• This is a political forum that is non-biased/non-partisan and treats every person's position on topics equally. This debate forum is not aligned to any political party. In today's politics, many ideas are split between and even within all the political parties. Often we find ourselves agreeing on one platform but some topics break our mold. We are here to discuss them in a civil political debate. If this is your first visit to our political forums, be sure to check out the RULES. Registering for debate politics is necessary before posting. Register today to participate - it's free!

James Hansen's Multiple Failed Global Warming Doomsday Ultimatums

Thank you for making my point. The conclusion of McShane & Wyner was that random statistical noise would produce a hockey stick. You have mistaken their devastating conclusion for an error.

As their own analysis says:

"Using our model, we calculate that there is a 36% posterior probability that 1998 was the warmest year over the past thousand. If we consider rolling decades, 1997-2006 is the warmest on record; our model gives an 80% chance that it was the warmest in the past thousand years."

Sounds like MBH98 to me!
 
New paper makes a hockey sticky wicket of Mann et al 98/99/08

We find that the proxies do not predict temperature significantly better than random series generated independently of temperature. Furthermore, various model specifications that perform similarly at predicting temperature produce extremely different historical backcasts. Finally, the proxies seem unable to forecast the high levels of and sharp run-up in temperature in the 1990s either in-sample or from contiguous holdout blocks, thus casting doubt on their ability to predict such phenomena if in fact they occurred several hundred years ago.
 
Then you should read the paper. That's their conclusion.

LOL.

*You* should read the paper. It appears you've only read WUWT posts, given how you never cite actual papers.

That's not in the conclusion. It also remains nonsensical, and I'll note that you have been unable to explain it.

I understand their general point, it's pretty technical and I have no way of evaluating the real truth - I'll rely on scientists I trust to do that. But I do know that the characterization by WUWT and (by proxy) you and the DP denier crowd is ludicrous.

I'll also point out their own reconstruction of the data, with their own methods.

ef3598db348c7eb5605cd6526dfbc689.gif


Looks like a winger's stick to me!
 
As their own analysis says:

"Using our model, we calculate that there is a 36% posterior probability that 1998 was the warmest year over the past thousand. If we consider rolling decades, 1997-2006 is the warmest on record; our model gives an 80% chance that it was the warmest in the past thousand years."

Sounds like MBH98 to me!

That means they claim there is a 64% chance 1998 was not the warmest!

Now I didn't do the new math like they teach today, but my recollection has 64% greater than 36%. Were you taught differently?
 
That means they claim there is a 64% chance 1998 was not the warmest!

Now I didn't do the new math like they teach today, but my recollection has 64% greater than 36%. Were you taught differently?

This is obviously all over your head.
 
Again...no one can explain it, they just regurgitate blogs.

And the paper cited has been well documented as deeply flawed.

https://deepclimate.org/2010/08/19/mcshane-and-wyner-2010/

The funniest thing about McShane and Wyner is that they put the data through their own program...and came out with this:


The Curious Case of the Hockey Stick that Didn't Disappear. Part 1: The Police Lineup | ThinkProgress

But the denier blogs always ignore that part....
I guess I missed where McShane and Wyner 2010 was retracted! Please cite!
The conclusion of McShane and Wyner 2010 is most damming.
6. Conclusion. Research on multi-proxy temperature reconstructions
of the earth’s temperature is now entering its second decade. While the
literature is large, there has been very little collaboration with university level,
professional statisticians (Wegman et al., 2006; Wegman, 2006). Our
paper is an effort to apply some modern statistical methods to these problems.
While our results agree with the climate scientists findings in some
respects, our methods of estimating model uncertainty and accuracy are in
sharp disagreement.
On the one hand, we conclude unequivocally that the evidence for a
”long-handled” hockey stick (where the shaft of the hockey stick extends
to the year 1000 AD) is lacking in the data. The fundamental problem is
that there is a limited amount of proxy data which dates back to 1000 AD;
what is available is weakly predictive of global annual temperature.
SO when real statisticians look at the same data, the results are inclusive.
 
I guess I missed where McShane and Wyner 2010 was retracted! Please cite!
The conclusion of McShane and Wyner 2010 is most damming.

SO when real statisticians look at the same data, the results are inclusive.

Again, when 'real' statisticians plot the data, the result is:

594bb767553fccd14ba21d9831207d6d.gif
 
Again, when 'real' statisticians plot the data, the result is:

594bb767553fccd14ba21d9831207d6d.gif
How come you did not include the caption for that graph?
FIG 16. Backcast from Bayesian Model of Section 5. CRU Northern Hemisphere annual mean land
temperature is given by the thin black line and a smoothed version is given by the thick black line. The
forecast is given by the thin red line and a smoothed version is given by the thick red line. The model
is fit on 1850-1998 AD and backcasts 998-1849 AD. The cyan region indicates uncertainty due to
t, the green region indicates uncertainty due to ~ , and the gray region indicates total uncertainty.
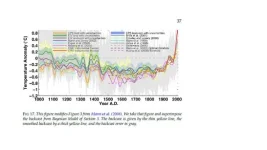
Or the next figure 17.
fig_17.jpg
 
LOL.

*You* should read the paper. It appears you've only read WUWT posts, given how you never cite actual papers.

That's not in the conclusion. It also remains nonsensical, and I'll note that you have been unable to explain it.

I understand their general point, it's pretty technical and I have no way of evaluating the real truth - I'll rely on scientists I trust to do that. But I do know that the characterization by WUWT and (by proxy) you and the DP denier crowd is ludicrous.

I'll also point out their own reconstruction of the data, with their own methods.

ef3598db348c7eb5605cd6526dfbc689.gif


Looks like a winger's stick to me!

From the McShane & Wyner abstract:

We find that the proxies do not predict temperature significantly better than random series generated independently of temperature. Furthermore, various model specifications that perform similarly at predicting temperature produce extremely different historical backcasts. Finally, the proxies seem unable to forecast the high levels of and sharp run-up in temperature in the 1990s either in-sample or from contiguous holdout blocks, thus casting doubt on their ability to predict such phenomena if in fact they occurred several hundred years ago.
 
How come you did not include the caption for that graph?

Or the next figure 17.
View attachment 67203972

I guess I not only have to refute the point, but now I have to document everything around it.

Funny how you don't call out The OP for just citing denier blogs instead of articles.


The main point is that it's still a hockey stick.

And that 'feeding random data' cannot produce an identical graph every time.
Except the yellow line is McShane and Wyner 2010 backcast, with the grey a much larger noise.
McShane and Wyner 2010 still shows extreme weaknesses in the hockey stick finding.
 
Except the yellow line is McShane and Wyner 2010 backcast, with the grey a much larger noise.
McShane and Wyner 2010 still shows extreme weaknesses in the hockey stick finding.

Keep pretending the red part doesn't exist.

Keep pretending larger reconstructions done later don't demonstrate similar hockey sticks, and have been met with silence from statistical critiques.
 
Last edited:
Keep pretending the red part doesn't exist.
Oh, the instrument (red part) of the record exists, it just demonstrates the differences in the proxies.
Thermometers are higher resolution temperature proxies than trees and pollen layers.
Speaking of the modern record, when is GISS going to show the June record?
The UAH June is down almost .2 C from may, the El Nino is subsiding fast.
 
You think random numbers get the same results, and the same models can predict both ice ages and a warming planet.

Interesting.

Stop playing ignorant just to get a response.
Models designed to show large temperature increase have been shown to produce temperature increases when fed random numbers.
 
Oh, the instrument (red part) of the record exists, it just demonstrates the differences in the proxies.
Thermometers are higher resolution temperature proxies than trees and pollen layers.
Speaking of the modern record, when is GISS going to show the June record?
The UAH June is down almost .2 C from may, the El Nino is subsiding fast.

lv, don't bother.
These people refuse to acknowledge that splicing temperature readings on to proxies is not extremely relaible.
Even when using the best available proxies which hasn't always been the effort. (ahem MBH98)
 
Stop playing ignorant just to get a response.
Models designed to show large temperature increase have been shown to produce temperature increases when fed random numbers.

Yet you don't know how this is possible.

The reason, of course, is that it's totally wrong, as the paper that was being touted as 'proof' shows.
 
lv, don't bother.
These people refuse to acknowledge that splicing temperature readings on to proxies is not extremely relaible.
Even when using the best available proxies which hasn't always been the effort. (ahem MBH98)

Yet the journals seem to disagree with you, since they have repeatedly published these studies.

I think I'll stick with the scientists on this one over a graphic designer.
 
Yet the journals seem to disagree with you, since they have repeatedly published these studies.

I think I'll stick with the scientists on this one over a graphic designer.

McShane & Wyner's conclusion:

6. Conclusion. Research on multi-proxy temperature reconstructions of theearth’s temperature is now entering its second decade. While the literature is large,A STATISTICAL ANALYSIS OF MULTIPLE TEMPERATURE PROXIES 41there has been very little collaboration with university-level, professional statisticians[Wegman, Scott and Said (2006), Wegman (2006)]. Our paper is an effort toapply some modern statistical methods to these problems. While our results agreewith the climate scientists findings in some respects, our methods of estimatingmodel uncertainty and accuracy are in sharp disagreement.On the one hand, we conclude unequivocally that the evidence for a “longhandled”hockey stick (where the shaft of the hockey stick extends to the year1000 AD) is lacking in the data. The fundamental problem is that there is a limitedamount of proxy data which dates back to 1000 AD; what is available is weaklypredictive of global annual temperature. Our backcasting methods, which trackquite closely the methods applied most recently in Mann (2008) to the same data,are unable to catch the sharp run up in temperatures recorded in the 1990s, evenin-sample. As can be seen in Figure 15, our estimate of the run up in temperaturein the 1990s has a much smaller slope than the actual temperature series. Furthermore,the lower frame of Figure 18 clearly reveals that the proxy model is not at allable to track the high gradient segment. Consequently, the long flat handle of thehockey stick is best understood to be a feature of regression and less a reflection ofour knowledge of the truth. Nevertheless, the temperatures of the last few decadeshave been relatively warm compared to many of the 1000-year temperature curvessampled from the posterior distribution of our model.Our main contribution is our efforts to seriously grapple with the uncertaintyinvolved in paleoclimatological reconstructions. Regression of high-dimensionaltime series is always a complex problem with many traps. In our case, the particularchallenges include (i) a short sequence of training data, (ii) more predictors thanobservations, (iii) a very weak signal, and (iv) response and predictor variableswhich are both strongly autocorrelated. The final point is particularly troublesome:since the data is not easily modeled by a simple autoregressive process, it followsthat the number of truly independent observations (i.e., the effective sample size) may be just too small for accurate reconstruction.Climate scientists have greatly underestimated the uncertainty of proxy-basedreconstructions and hence have been overconfident in their models. We have shownthat time dependence in the temperature series is sufficiently strong to permitcomplex sequences of random numbers to forecast out-of-sample reasonably wellfairly frequently (see Figures 9 and 10). Furthermore, even proxy-based modelswith approximately the same amount of reconstructive skill (Figures 11–13), producestrikingly dissimilar historical backcasts (Figure 14); some of these look likehockey sticks but most do not.Natural climate variability is not well understood and is probably quite large. Itis not clear that the proxies currently used to predict temperature are even predictiveof it at the scale of several decades let alone over many centuries. Nonetheless,paleoclimatoligical reconstructions constitute only one source of evidence in theAGW debate.42 B. B. MCSHANE AND A. J. WYNEROur work stands entirely on the shoulders of those environmental scientists wholabored untold years to assemble the vast network of natural proxies. Althoughwe assume the reliability of their data for our purposes here, there still remains aconsiderable number of outstanding questions that can only be answered with afree and open inquiry and a great deal of replication.

Thanks for pointing out that their conclusion does not state that random data will create a hockey stick shape.

I accept your awkward surrender.
 
Thanks for pointing out that their conclusion does not state that random data will create a hockey stick shape.

I accept your awkward surrender.

I guess I should have included the abstract.

[FONT=&quot]Predicting historic temperatures based on tree rings, ice cores, and other natural proxies is a difficult endeavor. The relationship between proxies and temperature is weak and the number of proxies is far larger than the number of target data points. Furthermore, the data contain complex spatial and temporal dependence structures which are not easily captured with simple models.[/FONT]
[FONT=&quot]In this paper, we assess the reliability of such reconstructions and their statistical significance against various null models. We find that the proxies do not predict temperature significantly better than random series generated independently of temperature. Furthermore, various model specifications that perform similarly at predicting temperature produce extremely different historical backcasts. Finally, the proxies seem unable to forecast the high levels of and sharp run-up in temperature in the 1990s either in-sample or from contiguous holdout blocks, thus casting doubt on their ability to predict such phenomena if in fact they occurred several hundred years ago.[/FONT]
[FONT=&quot]We propose our own reconstruction of Northern Hemisphere average annual land temperature over the last millennium, assess its reliability, and compare it to those from the climate science literature. Our model provides a similar reconstruction but has much wider standard errors, reflecting the weak signal and large uncertainty encountered in this setting.[/FONT]
 
Stop playing ignorant just to get a response.
Models designed to show large temperature increase have been shown to produce temperature increases when fed random numbers.

I'm not playing ignorant, your beliefs are explicitly contradictory.

Because you're not even aware you're talking about two completely different pieces of software.
 
I'm not playing ignorant, your beliefs are explicitly contradictory.

Because you're not even aware you're talking about two completely different pieces of software.

Oh please. Of course I know that. They don't use the same programs today that they used decades ago. Sheesh. That's why there's no contradiction.
The point was that the programs are written in order to support a conclusion. Every paper might use their own program. One additional problem is that too many use existing bad "data" from earlier research.
 
Back
Top Bottom