• Please read the Announcement concerning missing posts from 10/8/25-10/15/25.
  • This is a political forum that is non-biased/non-partisan and treats every person's position on topics equally. This debate forum is not aligned to any political party. In today's politics, many ideas are split between and even within all the political parties. Often we find ourselves agreeing on one platform but some topics break our mold. We are here to discuss them in a civil political debate. If this is your first visit to our political forums, be sure to check out the RULES. Registering for debate politics is necessary before posting. Register today to participate - it's free!

Perspectives on Temperature

Keep up the good work.

Thank you. I will try. If there is any time that you actually want to learn some of the basic science behind any aspect of this, I will be glad to help as I can.

As I've said many times before I am not an expert on climate but I am a career scientist and I understand some of the basics. I will be glad to help you out. Especially when it comes to how data is treated/processed. This is a key factor when assessing what someone tells you about a scientific topic.

One of the saddest things in our modern society is that people with no background in technical topics can so easily be "taken". There's still people out there who will buy "perpetual motion" type machines because they are so lacking in basic science that they can be easily led.

Thanks, but no thanks.
 
Thanks, but no thanks.

That's understandable. Science isn't easy. Not everyone can do it.

For me there is nothing wrong with having a different set of capabilities and not being capable of doing some things that others can. For me the greatest "sin" is pride in one's ignorance.
 
That's understandable. Science isn't easy. Not everyone can do it.

For me there is nothing wrong with having a different set of capabilities and not being capable of doing some things that others can. For me the greatest "sin" is pride in one's ignorance.

No, it's hubris.
 
No, it's hubris.

Hubris is a good word for it. When one is profoundly ignorant of a topic but decides to take a strong stand on it, that would be a form of hubris.
 
Hubris is a good word for it. When one is profoundly ignorant of a topic but decides to take a strong stand on it, that would be a form of hubris.

Not to put too fine a point on it, only one of us is relentlessly parading his claims of personal expertise: "Hubris: excessive pride or self-confidence."
 
Not to put too fine a point on it, only one of us is relentlessly parading his claims of personal expertise: "Hubris: excessive pride or self-confidence."

I am clearly and demonstrably more cognizant of the science we have so far discussed than you are, Jack.

I have shown it time and again. You, however, have repeatedly shown that you don't have any familiarity with even basic things like "logarithmic curves" or even basic statistics! On every single thing you've posted where I've asked you a technical question about it you have refused to even discuss it.

I, on the other hand, have discussed the technical topics at length.

To which the appropriate response is: So what?
 
[h=2]Year Of Global Cooling. JRC Analysis Show Land And Sea Surface Temperatures Continue To Fall[/h]By P Gosselin on 8. September 2020
Share this...


By Prof. Fritz Vahrenholt
The global mean temperature of the satellite-based measurements remained almost unchanged in August compared to July. The deviation from the 30-year average (1981 to 2010) was 0.43 degrees Celsius.
temp.jpg

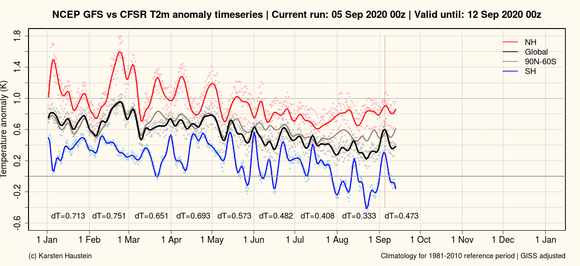
Temperature measurements on land and in the sea continue to decrease, as the graph of the JRC analysis shows, especially in the southern hemisphere (blue).
temp2.png

Approaching La Nina
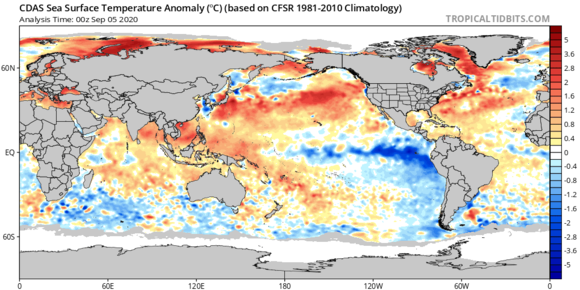
The research institutes predict with high probability a La Nina in the Pacific Ocean next winter. Therefore, a further decrease in global temperatures is expected until next spring. The following diagram shows the incipient cooling effect in the Pacific.
temp3.png


Nice weather report there. Imagine how someone who is really uneducated would try to use this as a commentary on anthropogenic global climate change, huh? They'd have to be a scientific illiterate!
 
Nice weather report there. Imagine how someone who is really uneducated would try to use this as a commentary on anthropogenic global climate change, huh? They'd have to be a scientific illiterate!

"Temperature measurements on land and in the sea continue to decrease . . . "
 
"Temperature measurements on land and in the sea continue to decrease . . . "

The quickest way to figure out if someone is scientifically illiterate is to watch how they treat data.
 
Temperature anomaly trending downward all year.

You can be forgiven for playing fast and loose with data because you don't have any experience with it. But I would just note that when shown a time-series of data it is wholly improper to randomly window the data down.

I know you don't have any data processing background (you earlier showed you don't know the basics of statistical analysis of data) but you should be warned that drawing a conclusion based on one years' data in a longer noisy time-series data set is VERY LIKELY to lead to wrong conclusions. Certainly not conclusions supported by the actual data.
 
Last edited:
You can be forgiven for playing fast and loose with data because you don't have any experience with it. But I would just note that when shown a time-series of data it is wholly improper to randomly window the data down.

I know you don't have any data processing background (you earlier showed you don't know the basics of statistical analysis of data) but you should be warned that drawing a conclusion based on one years' data in a longer noisy time-series data set is VERY LIKELY to lead to wrong conclusions. Certainly not conclusions supported by the actual data.

Which is why the post refers to a "year" of cooling.
 
[h=2]Year Of Global Cooling. JRC Analysis Show Land And Sea Surface Temperatures Continue To Fall[/h]By P Gosselin on 8. September 2020
Share this...


By Prof. Fritz Vahrenholt
The global mean temperature of the satellite-based measurements remained almost unchanged in August compared to July. The deviation from the 30-year average (1981 to 2010) was 0.43 degrees Celsius.
temp.jpg

Temperature measurements on land and in the sea continue to decrease, as the graph of the JRC analysis shows, especially in the southern hemisphere (blue).
temp2.png

Approaching La Nina
The research institutes predict with high probability a La Nina in the Pacific Ocean next winter. Therefore, a further decrease in global temperatures is expected until next spring. The following diagram shows the incipient cooling effect in the Pacific.
temp3.png


Oh boy... its more denialist lies and misinformation from Jack and the hacks over at NoTricksZone!!! And NTZ provides no links to their sources what so ever. So much for being well-sourced.

As I pointed out less than 2 months ago the second graph is not of recorded temperature anomalies. It is a reanalysis of a weather forecasting model and does not accurately reflect actual temperature changes.

And the current forecast of ENSO from the "Research Institute" is:

There is a ~60% chance of La Niña development during Northern Hemisphere fall 2020 and continuing through winter 2020-21 (~55% chance).
https://www.cpc.ncep.noaa.gov/products/analysis_monitoring/enso_advisory/ensodisc.shtml

Now I wouldn't call a 60% chance of La Nina and a 55% chance of it continuing through winter to be a "high probability". More like slightly more than a 50-50 chance.

Jack has been suckered yet again.
 
Which is why the post refers to a "year" of cooling.

One year in a graph of 40 is not sufficient to draw any meaningful conclusions.

That is still noise within the data. Give it a few more years to see if there is a real trend.

Remember the earlier discussion of statistics on regression? Yeah, it's kind of like that. In time-series data it is even more complex. But generally you can't just interpret the noise. You have to ensure it is a real signal.

Noise is noise.
 
Oh boy... its more denialist lies and misinformation from Jack and the hacks over at NoTricksZone!!! And NTZ provides no links to their sources what so ever. So much for being well-sourced.

As I pointed out less than 2 months ago the second graph is not of recorded temperature anomalies. It is a reanalysis of a weather forecasting model and does not accurately reflect actual temperature changes.

And the current forecast of ENSO from the "Research Institute" is:

Climate Prediction Center: ENSO Diagnostic Discussion

Now I wouldn't call a 60% chance of La Nina and a 55% chance of it continuing through winter to be a "high probability". More like slightly more than a 50-50 chance.

Jack has been suckered yet again.

Sorry, but the graph is sourced and you're in denial.
 
One year in a graph of 40 is not sufficient to draw any meaningful conclusions.

That is still noise within the data. Give it a few more years to see if there is a real trend.

Remember the earlier discussion of statistics on regression? Yeah, it's kind of like that. In time-series data it is even more complex. But generally you can't just interpret the noise. You have to ensure it is a real signal.

Noise is noise.

Yawn. It's about this year. Nothing more, nothing less.
 
Sorry, but the graph is sourced and you're in denial.

That is a lie!!. The graph is not sourced. Or maybe you can show me where the source is in the NTZ post.

Here is the link to the source if anyone is curious to know where the graph came from.
 
That is a lie!!. The graph is not sourced. Or maybe you can show me where the source is in the NTZ post.

Here is the link to the source if anyone is curious to know where the graph came from.

Yes, just as labeled in the NTZ post.
 
Yes, just as labeled in the NTZ post.

BS!! There are no links to the sources of any of the graphs anywhere in that post. And by your own standard, something like this is not sourced unless it has a link.
 
BS!! There are no links to the sources of any of the graphs anywhere in that post. And by your own standard, something like this is not sourced unless it has a link.

Nope. Sourced on the graph is fine. Always has been for me.
 
Nope. Sourced on the graph is fine. Always has been for me.

Another outright lie. You have, in fact, demanded that other people have to link to the sources of their graphs.

Do I really need to find the post where you bitched about 3G not linking to his graphs?
 
Another outright lie. You have, in fact, demanded that other people have to link to the sources of their graphs.

Do I really need to find the post where you bitched about 3G not linking to his graphs?

The requirement for a link is DP's, not mine. In this case, btw, the requirement is met by the NTZ link. As for the graph's authenticity, the label it carries is sufficient.
 
Back
Top Bottom