• This is a political forum that is non-biased/non-partisan and treats every person's position on topics equally. This debate forum is not aligned to any political party. In today's politics, many ideas are split between and even within all the political parties. Often we find ourselves agreeing on one platform but some topics break our mold. We are here to discuss them in a civil political debate. If this is your first visit to our political forums, be sure to check out the RULES. Registering for debate politics is necessary before posting. Register today to participate - it's free!

Perspectives on Temperature

The requirement for a link is DP's, not mine. In this case, btw, the requirement is met by the NTZ link. As for the graph's authenticity, the label it carries is sufficient.

Oh... that's right, you have a double standard for what you consider "well-sourced".

Just like your double standard for what is and isn't "just weather".

Or your double standard on whether or not profiting off of climate change is o.k. or not. Like when Al Gore makes money off of climate change that is horrible but Anthony Watts living off of climate denial is just fine with you.

You have a lot of double standards.

No. You just have a bad memory and a penchant for tantrums.
 
No. You just have a bad memory and a penchant for tantrums.

More lies.

I can back up every single thing I am saying with quotes of you saying exactly what I am accusing you of. You can't.

We have been through this before, Jack... is your memory really that bad, or are you just completely unable to debate honestly?
 
More lies.

I can back up every single thing I am saying with quotes of you saying exactly what I am accusing you of. You can't.

We have been through this before, Jack... is your memory really that bad, or are you just completely unable to debate honestly?

All of which is irrelevant distraction. You should consider switching to decaf.
 
All of which is irrelevant distraction.

You are the one who decided to ignore two points I made about your post and just respond to the fact that your graphs are not well-sourced. By all means... if you want to address the other two points I made... then be my guest!! Let's hear you refute what I am saying.

Jack Hays said:
You should consider switching to decaf.

I haven't drank any coffee at all in close to two weeks.

Do you realize that this is nothing but an ad hominem attack? Or are you still having a hard time understanding what an ad hominem attack really is? Actually, it is worse than an ad hominem attack because you have no evidence what so ever that I am even drinking coffee.
 
You are the one who decided to ignore two points I made about your post and just respond to the fact that your graphs are not well-sourced. By all means... if you want to address the other two points I made... then be my guest!! Let's hear you refute what I am saying. . . .

Your "other two points" neither required nor merited a response.
 
Yawn. Denial.

When one doesn't even know basic high school math like what a log curve is let alone more advanced concepts like how statistics is used in it can be very easy to get lost in the technical details.

I understand.

You have your skill set and I have mine. I just happen to have the skillset that encompases "numerical data".

Sorry, but a year's worth of cooling is just that, no more and no less. And all your arm waving doesn't change a thing.
 
Sorry, but a year's worth of cooling is just that, no more and no less. And all your arm waving doesn't change a thing.

So long as you understand this has literally no value to the conversation about AGW.

I'm OK with you finding noise in the data. That's how data works. But just so long as you aren't confused into think it has some bearing on the concept of AGW.
 
So long as you understand this has literally no value to the conversation about AGW.

I'm OK with you finding noise in the data. That's how data works. But just so long as you aren't confused into think it has some bearing on the concept of AGW.

Let's see how long the cooling continues.
 
Let's see how long the cooling continues.

EXACTLY! That is exactly what the discussion centers on. 1 year's worth of cooling (if, indeed, it really is cooling) won't have any meaning. But MANY YEARS OF IT WILL.

This is why I hammer on so about the statistics on the regression. There's always NOISE in the data. The key is we can't call it a signal until it rises to a certain level.

In case you're curious, my position on the cooling is that I think we will see cooling if the next couple solar cycles continue to get weaker. I stated that those several years back at the start of the solar cycle we are now coming out of.

When I first started researching Climate Change, My first determination for the solar influence was the conclusion we see the effect, after 55 to 70 years. I have since decided to use a dynamic exponential formulation, based on Hansen's 81 to 120 years for 60% equalization. It's still not that simple though, as the ocean itself has a 1,000 year or so cycle, and waters coming to the surface from the deep can have varying heat contents.

Too many significant factors, but I do believe the sun has a greater influence on our climate change than CO2 does.
 
Your "other two points" neither required nor merited a response.

That is just more denial.

The fact of the matter is that your second graph exaggerates this year's temperature swings by more than 2 times. And your source basically lies about the current ENSO prediction.
 
That is just more denial.

The fact of the matter is that your second graph exaggerates this year's temperature swings by more than 2 times. And your source basically lies about the current ENSO prediction.

Tsk tsk. So much anger.
 
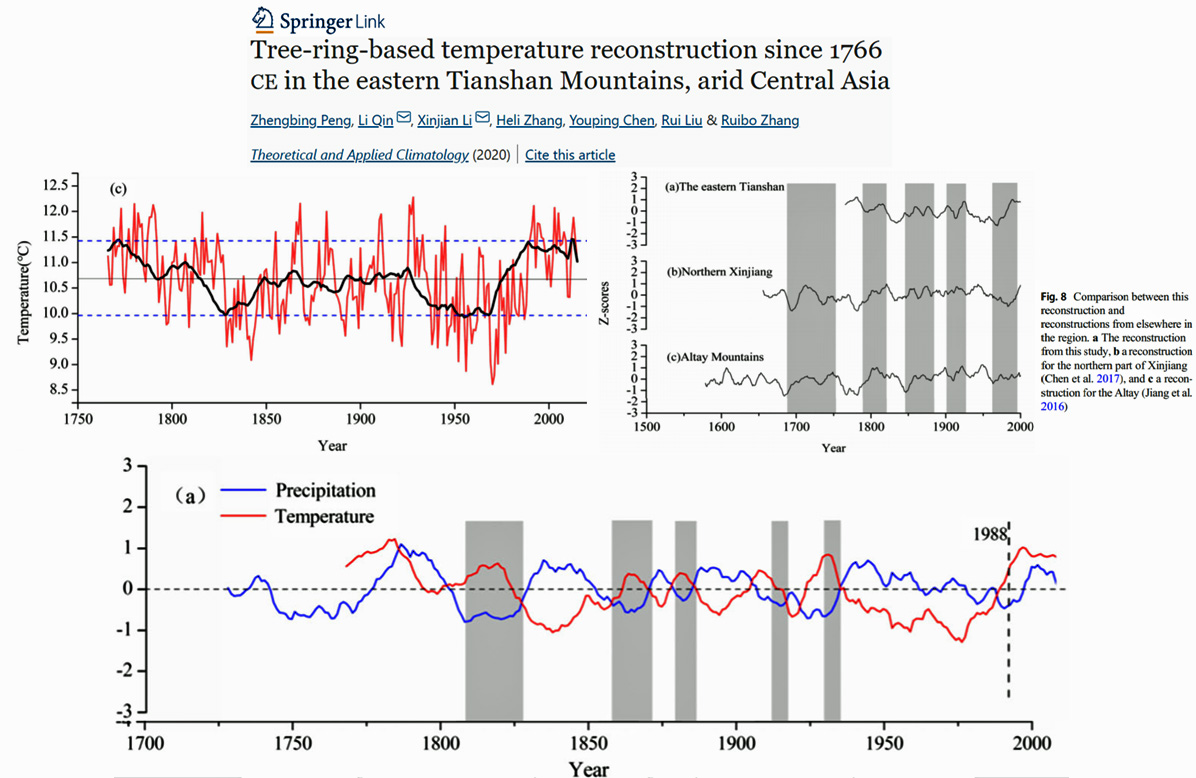
[h=2]Two New Temperature Records Show No Warming In Central Asia Since 1766 A.D. Or In Spain Since 1350 A.D.[/h]By Kenneth Richard on 10. September 2020
Share this...


[h=4]Scientists continue to publish papers revealing no unusual climate trends for the last several centuries in many regions of the world.[/h]Despite the 135 ppm increase in CO2 concentration (275 ppm to 410 ppm) since the 1700s, a new 250-year temperature (precipitation) reconstruction (Peng et al., 2020) shows there has been no net warming in Central Asia since 1766. Two other reconstructions from this region also show no warming trend in recent centuries.
Holocene-Cooling-Central-Asia-Peng-2020.jpg

[h=6]Image Source: Peng et al., 2020[/h]Earlier this year we highlighted a new study that indicated France was up to 7°C warmer than today about 7800 years ago after cooling by 3°C in the last 200 years.
Another new study (Esper et al., 2020) suggests there has been no net warming in Spain since 1350 A.D. . . .
 

It is called anthropogenic GLOBAL climate change. The word in caps there is the important one.

There are regional trends that go up and down and all around, but localized, regional stuff isn't the topic.

This is why statistics, again, is important.

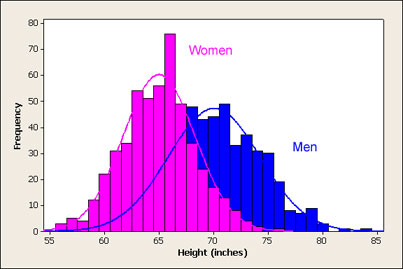
As an example: here's two HISTOGRAMS showing the DISTRIBUTION of heights of women and men:

men_women_height_histogram.jpg


Adult men average 70" tall, and adult women average 65".

Now note that these are DISTRIBUTIONS, meaning that some men are actually 65" tall or less!

What you are doing with "localized" climate is picking out a being who is 65" and assuming it is a woman. That is not correct.


Climate change is very much like that, but instead of "height" we talk about change in temperature.

There is a distribution of behaviors but we can learn a lot from the ensemble of data that you CANNOT see in individual data points.


------------------------------
Here's an explanation of what a "histogram" is if you need some background: Histograms

You are pushing against a door no one is trying to open. Yes, these are regional temperature records. So what? The thread title is "Perspectives on Temperature," not Perspectives on Global Temperature.
 
You are pushing against a door no one is trying to open.

Actually everyone who understands the topic from a technical point knows this door is critical. If you are aware of how the temperature anomaly data is processed you would know that large scale grid averaging exists to expand out the data from single data points.

Yes, these are regional temperature records. So what? The thread title is "Perspectives on Temperature," not Perspectives on Global Temperature.

The histogram I posted is why. You cannot take one data point and draw some meaningful conclusion. This creature is 62" tall...it may very well be a man who is shorter than the average. Does that mean there are NO DIFFERENCES IN HEIGHT BASED ON GENDER? No. The data shows us that there IS a difference based on gender. Just not every data point is meaningful. The ensemble is.

Again, the development of statistics represents one of the most powerful tools know to science to understand data.
 
Actually everyone who understands the topic from a technical point knows this door is critical. If you are aware of how the temperature anomaly data is processed you would know that large scale grid averaging exists to expand out the data from single data points.


The histogram I posted is why. You cannot take one data point and draw some meaningful conclusion. This creature is 62" tall...it may very well be a man who is shorter than the average. Does that mean there are NO DIFFERENCES IN HEIGHT BASED ON GENDER? No. The data shows us that there IS a difference based on gender. Just not every data point is meaningful. The ensemble is.

Again, the development of statistics represents one of the most powerful tools know to science to understand data.

The presented papers do not claim to be global. They passed peer review and were published. You have no point.
 
The presented papers do not claim to be global. They passed peer review and were published. You have no point.

Fair enough. Normally when skeptic blogs post things like this it is in service to the larger "doubt for doubt's sake" gambit but I'll take your word for it that they are only interested in this particular small area. Unfortunately they don't say why they are posting this.
 
47 terawatts of heat are conducted from below to the surface, but the rate of conductivity is low enough that the effect is ignored for most applications. Advocates of AGW ignore heat conduction in the crust and talk only about the heating of the atmosphere and oceans.

What's amazing though is that there's so much money funding so many studies of the heating of the atmosphere&oceans, but nobody wants to say what the average temp is. A hundred million miles away everyone agrees that the surface of the sun is exactly 5,778K, but right here at home everyone's close-lipped about the temp of the earth's surface.

I know your question is rhetorical and here's mine: Are AGW scientists ignoring the temp of the earth and, instead, measuring the amount of change of CO2 in the atmosphere, for example? Is the amount of change of CO2 in the 'sphere a direct indication of (or not) warming of the earth?
 
I know your question is rhetorical and here's mine: Are AGW scientists ignoring the temp of the earth and, instead, measuring the amount of change of CO2 in the atmosphere, for example? Is the amount of change of CO2 in the 'sphere a direct indication of (or not) warming of the earth?

Both temperature and CO2 levels are measured in a variety of ways. Hope this helps.
 
Fair enough. Normally when skeptic blogs post things like this it is in service to the larger "doubt for doubt's sake" gambit but I'll take your word for it that they are only interested in this particular small area. Unfortunately they don't say why they are posting this.

If all sides would simply take the data as they are rather than try to impute motive, this debate would be a more positive exercise.
 
Back
Top Bottom