• This is a political forum that is non-biased/non-partisan and treats every person's position on topics equally. This debate forum is not aligned to any political party. In today's politics, many ideas are split between and even within all the political parties. Often we find ourselves agreeing on one platform but some topics break our mold. We are here to discuss them in a civil political debate. If this is your first visit to our political forums, be sure to check out the RULES. Registering for debate politics is necessary before posting. Register today to participate - it's free!

Perspectives on Temperature

If all sides would simply take the data as they are rather than try to impute motive, this debate would be a more positive exercise.

That's a fair point.

It's like accusing Cook of uploading photos to a webpage despite having no actual evidence that he did so. We can only draw the conclusions that have evidence, not what would confirm our bias.
 
That's a fair point.

It's like accusing Cook of uploading photos to a webpage despite having no actual evidence that he did so. We can only draw the conclusions that have evidence, not what would confirm our bias.

I think there's enough evidence. You and I just differ on what "enough" is.
 
I think there's enough evidence. You and I just differ on what "enough" is.

So why didn't you provide the evidence? As I recall all you could muster was that Cook was one of the leads of the page and hence he had to take "responsibility". That isn't evidence that he actually DID it.
 
So why didn't you provide the evidence? As I recall all you could muster was that Cook was one of the leads of the page and hence he had to take "responsibility". That isn't evidence that he actually DID it.

I did.
 
It is called anthropogenic GLOBAL climate change. The word in caps there is the important one.

There are regional trends that go up and down and all around, but localized, regional stuff isn't the topic.

This is why statistics, again, is important.

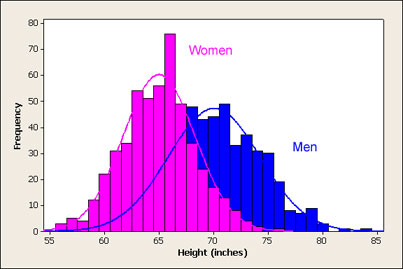
As an example: here's two HISTOGRAMS showing the DISTRIBUTION of heights of women and men:

men_women_height_histogram.jpg


Adult men average 70" tall, and adult women average 65".

Now note that these are DISTRIBUTIONS, meaning that some men are actually 65" tall or less!

What you are doing with "localized" climate is picking out a being who is 65" and assuming it is a woman. That is not correct.


Climate change is very much like that, but instead of "height" we talk about change in temperature.

There is a distribution of behaviors but we can learn a lot from the ensemble of data that you CANNOT see in individual data points.


------------------------------
Here's an explanation of what a "histogram" is if you need some background: Histograms

Facts make statistics. Statistics do not make facts, and I am appalled at any scientists who tries to make such a claim.
 

No, you didn't.

You said he was "responsible" because it was his webpage. But you never established that:

1. He was the only one who could upload to a forum
2. That he DID upload these to the forum

So you failed to provide evidence that he did upload them to the forum.
 
Facts make statistics. Statistics do not make facts, and I am appalled at any scientists who tries to make such a claim.

I never said statistics make facts. What I said was that statistics help us understand whether what we are seeing is real or noise.
 
No, you didn't.

You said he was "responsible" because it was his webpage. But you never established that:

1. He was the only one who could upload to a forum
2. That he DID upload these to the forum

So you failed to provide evidence that he did upload them to the forum.

I'm satisfied and that's all that matters. I've drawn conclusions on less.
 
I never said statistics make facts. What I said was that statistics help us understand whether what we are seeing is real or noise.

Throwing out outliers is throwing out data. What sigma level would you use? We would use three sigma in the past, but still look at the outliers in a past profession I was in.
 
Throwing out outliers is throwing out data. What sigma level would you use? We would use three sigma in the past, but still look at the outliers in a past profession I was in.

There are standard tests for outliers

1.3.5.17. Detection of Outliers
NIST said:
"The following are a few of the more commonly used outlier tests for normally distributed data. This list is not exhaustive (a large number of outlier tests have been proposed in the literature). The tests given here are essentially based on the criterion of "distance from the mean". This is not the only criterion that could be used. For example, the Dixon test, which is not discussed here, is based a value being too large (or small) compared to its nearest neighbor.

Grubbs' Test - this is the recommended test when testing for a single outlier.

Tietjen-Moore Test - this is a generalization of the Grubbs' test to the case of more than one outlier. It has the limitation that the number of outliers must be specified exactly.

Generalized Extreme Studentized Deviate (ESD) Test - this test requires only an upper bound on the suspected number of outliers and is the recommended test when the exact number of outliers is not known.
 
Austrian Analyst: Things With Greenhouse Effect (GHE) Aren’t Adding Up…”Something Totally Wrong”

By P Gosselin on 11. September 2020
Share this...


Something is rotten with the GHE

By Erich Schaffer
Introduction
The greenhouse effect (GHE) is a well established theory which most people consider a solid fact, even those who are otherwise “critical” over global warming. On the other side there are some voices who “deny” the GHE with flatearther-like arguments, which seemingly only adds to the credibility of the theory. This is a very odd situation, since there are huge issues with the GHE hidden in plain sight.
“Without GHGs, the Earth would be a frozen planet with a temperature of only -18°C, or 255°K”. This definition is all too familiar to us all and the experts naming it are legion. The 255°K isthe result of a (relatively) simple formula.
(342 x ((1-0.3) / 1) / 5.67e-8) ^0.25 = 255
342W/m2 is the amount of solar radiation (the exact number may vary), 5.67e-8 is the Stefan-Boltzmann constant and ^0.25 (or the 4th root) represents the Stefan-Boltzmann law according to which radiation is a function of temperature to the power of 4.
Black body assumption trouble
The interesting part however is (1-0.3 / 1). 0.3 is the albedo of Earth and 1-0.3 os thus the absorbtivity, which is the share of solar radiation the Earth absorbs (~70%). The 1 below the comma, which is usually omitted, represents emissivity, which is the share of LWIR emitted by the Earth relative to a perfect black body of the same temperature. In other words, it is being assumed Earth would be emitting just like a perfect black body if it were not for GHGs. And that is where the trouble starts.
The basic problem
Quite obviously there are two factors that “violate” the assumption named above.

  1. The surface of the Earth, mainly consisting of water, is not a perfect emitter, pretty much like any real surface. Although it is not the scope of this article, it can be shown there is a significant deviation from 1 (in the 0.91 to 0.94 range). One needs to look up Fresnel equations, the refractive index of water and so on to sort out this subject.
  2. Clouds interfere massively with LWIR emissions. Actually this is common wisdom, as “clear nights are cold nights” and most people have made the according experience. Even the IPCC states clouds would block a 50W/m2 of SW radiation, retain a 30W/m2 of LWIR and thus have a net CRE (Cloud Radiative Effect) of -20W/m2 [1]. Of course those -50W/m2 of SW CRE are already included in the formula above (part of the 30% albedo), while the 30W/m2 of LW CRE are not. . . .

I didn't read that, but yes. Water makes the solar radiation that strikes it. a linear absorbent, not a 4th power equation.
 
[h=2]Greta Thunberg’s Scandinavia Has Seen August Cooling Trend Over The Past Quarter Century[/h]By P Gosselin on 13. September 2020
Share this...


By Kirye
and Pierre Gosselin
Today we plot the Japan Meteorological Agency (JMA) data for Northern Europe for the month of August, 2020.
We have selected this region because it is the home of 17-year old climate alarmist/activist Greta Thunberg, who thinks the planet is heating up rapidly and so we’re all doomed.
We plot the data for the stations for which the JMA has sufficient data going back over 2 decades. First we plot the August data for Sweden, Greta’s home country:

Data: JMA
Five of the 6 stations plotted show a cooling trend. So it’s a mystery how Greta thinks her country is warming up. The data suggest that summers have been shortening a bit. Over the course of Greta’s life, she has yet to see warming in August.
Next we examine Norway, Greta’s western neighbor: . . .
 

A New Cold Record set at International Falls: Should we be surprised?
News has come from the Duluth office of the National Weather Service that both International Falls & Hibbing broke their records for low temperatures on the morning of September 17. The Falls got to 23°, breaking the old record of 24° set in 1959, and Hibbing to 24°.
 
In my lifetime in the UK (I'm 45) the weather has changed quite a bit.

Summers are much warmer now and when we do get snow in winter it's much more severe. The UK doesn't really suffer from super violent weather though as many places in the US but our houses are not built to cope with super hot weather.

Obviously the UK is a small country but here climate change is having an effect and the UK is having to spend a fair bit more than it used to do on coastal defences as the weather gets more unpredictable.

There is no evidence for more severe weather in the UK.
 
LOL.

Until you understand how statistics of time-series works you will always be convinced points like this matter.

Trust me, no one who actually understands this topic is "impressed" with this. In fact people who go after this sort of thing are laughed at by scientists. That's why this is a "video" rather than an article.

Pointing out a couple of data points in a very large data set, especially one that is noisy and autocorrelated is a big red flag that the person who is talking about it as if it is meaningful is really, really uneducated.

Seriously so.
It's obvious you didn't watch the video. It chronicled several other cities with record heat in 1913.

Statistics do not make facts...
 
It isn't as "I" wish. It is how life works. One must know something about a topic before one speaks authoritatively on it.
You should practice what you preach.
 
2020: A Year Of Global Surface Cooling…And Sun Showing Little Activity, Spotless 30 Days
By P Gosselin on 25. September 2020

Our friend “Snowfan” here reports the sun has now gone 30 days without sunspots as we progress into solar cycle 25.
A number of scientists have been warning that the earth may be heading into a cooling phase due to lower sunspot activity over the past 15 years.

Is cooling in the works? Solar activity has been tapering Since 1980. Source: SpaceWeatherLive.
The low sunspot activity comes after a 20th century of high sunspot activity – perhaps a major reason for the strong warming since 1980, a number of atmospheric physicists suggest.
2020: A year of global surface cooling

Source: Global 2m-TA
The GFS forecast of global 2-meter surface temperatures for September 20-27, 2020 (black line) show a new annual low with respect to the WMO 1981-2010 climate mean. This also applies to temperatures in the southern hemisphere (SH, bold blue line). . . .
 
Back
Top Bottom