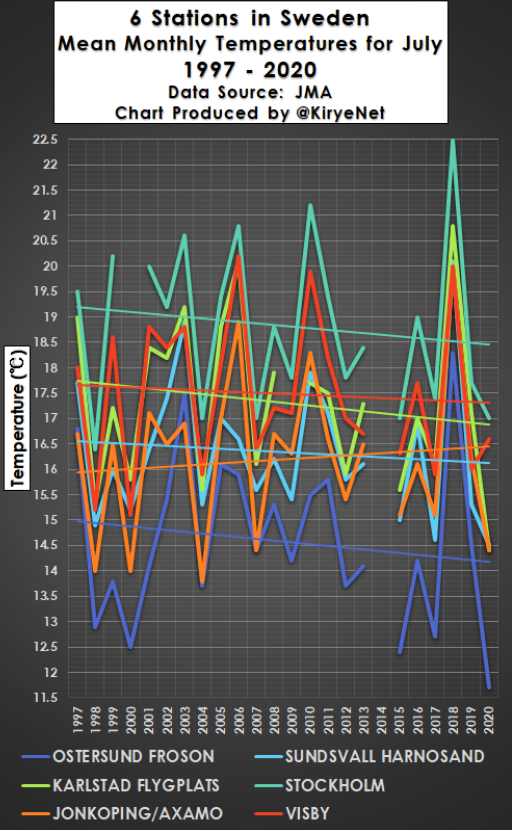
OK, Jack, I've wasted some time to make an actual point for you. I generated this graph and ran it through R for statistics.
Do you see the line that looks like a "slope" pointing downwards?
THAT ISN'T A REAL TREND.
But it looks like a real slope downward, right? Well see that F-test value up there and specifically the "p-value". This is, at its most basic a test of
if this regression is statistically significant.
The p-value is VERY HIGH meaning
it is NOT STATISTICALLY SIGNIFICANT.. It means that there's really no value to explaining the data using the LINE vs just the MEAN OF THE DATA.
This happens, statistically, through random chance. Sometimes it looks like a regression is real, but you don't really know
until you run the F-test.
Now, I'm not saying that Gosselin's data is similarly NOT a real trend, I'm just saying that
unless you can show me the statistical analysis of the regression I won't accept just by looking at the pretty picture.
Again, this is basic statistics. Stuff they teach freshmen. It is the essence of what it means to understand science.
You think you're a "skeptic"? Your skepticism has no value
if you don't know how to assess the data even at a basic level.