- Joined
- Sep 23, 2006
- Messages
- 19,295
- Reaction score
- 8,601
- Gender
- Undisclosed
- Political Leaning
- Undisclosed
The amount withhrld, 1960-61 was 3% of employee earnings and 1.5% semi-match from employer-snip-
By law, FICA surpluses become special Treasury debt.
They weren't siphoned... instead, they continue to be paid interest and will become more of a future liability. What was the alternative? Could S.S. surpluses have been used to purchase existing public debt? Sure, but that doesn't account for what happens to these funds upon maturity as they wouldn't be sitting in a cash account.
It correctly depicts current revenue less current outlays.
That was by design going back to 1982.
Legislation, including Medicare and several SS "fixes" like later retirement age and gradual withholding increases
were passed before the 1983 Greenspan Commission accelerated the withholding increases beyond the time table in the prior
legislation.
By 1990, the withholding for SS and Medicare was set at $7.65% of employee earnings and 7.65% match from employer.
We now know this resulted in withholding $2.9 trillion more than what was required to meet SS retirement payout obligations.
The taxpayer is, going forward, obligated identically as if that $2.9 trillion had not been withheld and SS beneficiaries are extorted, compared to SS holding Trust Fund assets other than U.S. Treasury bonds, by demands such as the current threat to freeze the debt ceiling.
The losers are the boomers who were the first to experience a mass transfer of their earnings to general federal revenue during their working years for which they not only receive no benefit but are on the hook, per capita exposure, for that $2.9 trillion debt,
and having a government burdened by that additional debt obligation compared to a government that had actually taxed from the late 1980s until now at rates that would have collected an additional $2.9 trillion.
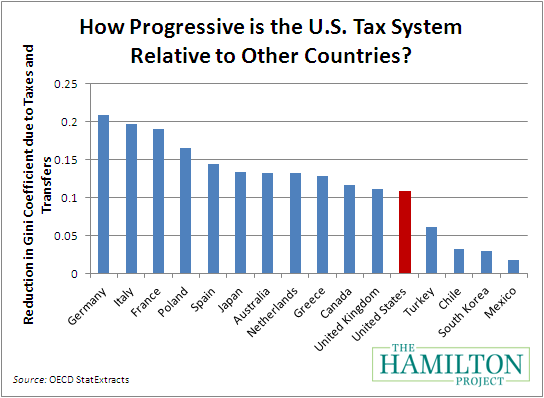
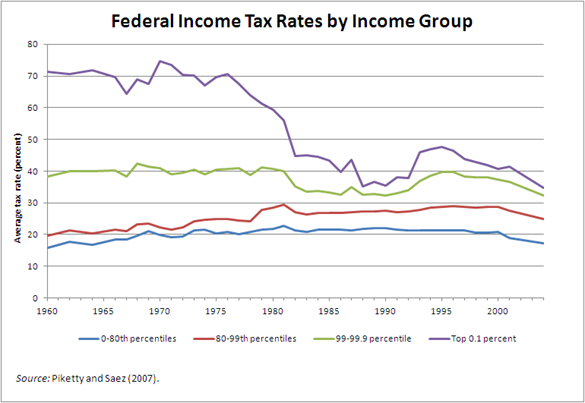
Taxcuts primarily benefiiting the wealthiest were passed in 2001, and in 2017, and the IRS appropriations were
targeted to reduce its collections results and threat to enforce tax law.

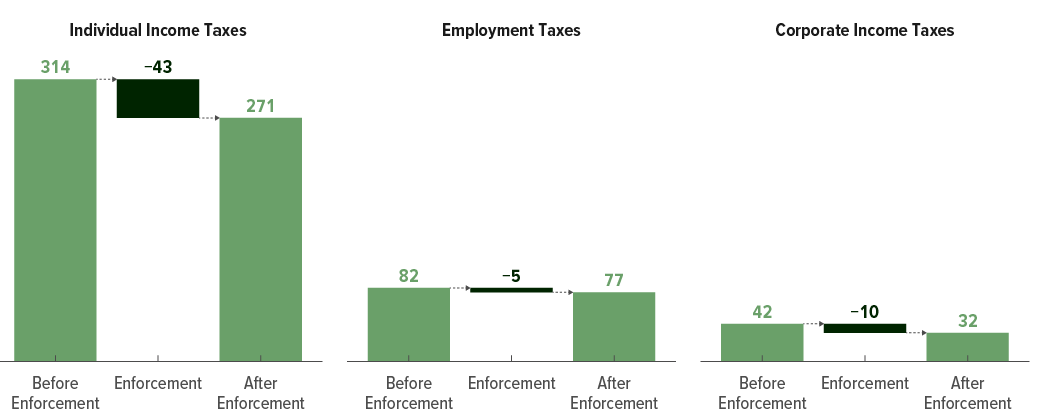
Trends in the Internal Revenue Service’s Funding and Enforcement
At a Glance The Internal Revenue Service (IRS) promotes compliance with tax laws in many ways: It verifies information provided by taxpayers, works to prevent the distribution of refunds that are claimed erroneously, audits tax returns, and attempts to collect unpaid taxes and unfiled returns...
"...How Has Funding for the Internal Revenue Service Changed Over Time?
Appropriations for the IRS have fallen by a total of about 20 percent in real (inflation-adjusted) dollars between 2010 and 2018. With the exception of 2016, real appropriations have consistently fallen below the previous year’s level over that period. Because labor costs account for about 70 percent of the IRS’s budget, measures to reduce its workforce were instituted, including a hiring freeze. Those measures resulted in a 22 percent decline in the number of employees at the agency and a 30 percent decline in the number of employees working in enforcement roles.1 The number of revenue agents and revenue officers, highly specialized enforcement employees who handle the most complex examinations and collections cases, fell by 35 percent and 48 percent, respectively, between 2010 and 2018.How Have Reductions in Funding and Staffing Affected Enforcement?
As the IRS’s budget and workforce declined, so did its examination rates for both individual and corporate income tax returns. (The examination rate is the number of examinations closed in a fiscal year divided by the number of returns filed in the previous calendar year.) The overall examination rate for all returns fell by about 40 percent between 2010 and 2018. Over that period:- The examination rate for individual income tax returns dropped by about 46 percent. About 0.6 percent of individual income tax returns were examined in 2018..."
Last edited:
:max_bytes(150000):strip_icc()/currentfederalbudget-69f8c6b6a933487789833e7d44b4b2b6.jpg)
")