• This is a political forum that is non-biased/non-partisan and treats every person's position on topics equally. This debate forum is not aligned to any political party. In today's politics, many ideas are split between and even within all the political parties. Often we find ourselves agreeing on one platform but some topics break our mold. We are here to discuss them in a civil political debate. If this is your first visit to our political forums, be sure to check out the RULES. Registering for debate politics is necessary before posting. Register today to participate - it's free!

The definitive post on why global warming is not 'paused' and is not 'cooling'.

Threegoofs

Sophisticated man-about-town
Supporting Member
DP Veteran
Joined
Mar 31, 2013
Messages
63,585
Reaction score
28,952
Location
The city Fox News viewers are afraid to travel to
Gender
Male
Political Leaning
Undisclosed
From Tamino's blog:

Global Temperature: the Post-1998 Surprise | Open Mind

Great explanation for the learning impaired.

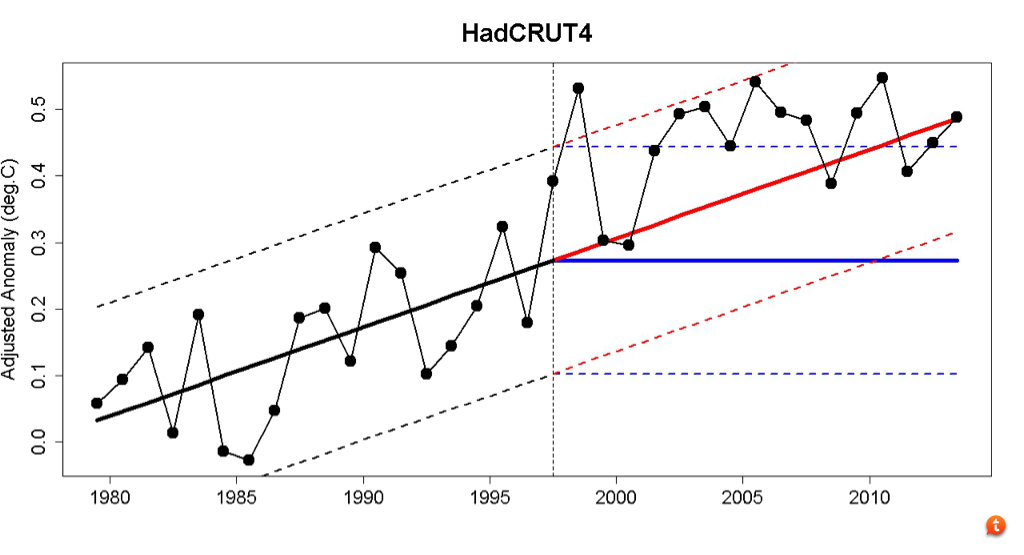
Here's the setup. In 1998, if someone told you warming was stopped vs continue, imagine you plotted two lines (blue = no more warming - average of the past few years, red= continued warming). What does the data show?


7eve3a4e.jpg
 
Another flamebait thread rehashing the same old same old despite the reality of the pause having been acknowledged by even the likes of James Hansen :roll:
 
It is a very simple calculation on an Excel spreadsheet to find out the earliest date from which the slope of temperature change to the present is zero or less. Using the latest HADCRUT4 data set it turns out to be November 2000. Prior to that date, they are all positive. Since 1850 the slope is a positive 0.0046 per year which adds up to a 0.75°C rise in temperature since that date. Since November of 2000 (2000.83) the slope is a negative -0.00020 which adds up to a drop in temperature of minus -0.0025 since then. The 2013.08 anomaly would have to have been at least 0.86 before that earliest date becomes more recent. Here are the pertinent rows from my Excel spreadsheet:

row#; yyyy.xx; anomaly; slope
...
0001; 1850.00; -0.695; 0.0046
...
1811; 2000.75; 0.209; 0.00063
1812; 2000.83; 0.151; -0.00020 [=SLOPE(B1811:B$1958,A1811:A$1958)]
...
1957; 2013.00; 0.432; 0.60
1958; 2013.08; 0.482

What does it mean?
Temperatures have been flat since November 2000.

[Posted over at Open Mind' and they tell me, "Your comment is awaiting moderation." we'll see how open they are. ]
 
Last edited:
Another flamebait thread rehashing the same old same old despite the reality of the pause having been acknowledged by even the likes of James Hansen :roll:

You mean the guy who supposedly modifies temperature data to fit an agenda?

Why wouldn't he instead... you know... modify the temperature data, so there's no pause? :roll:


What he actually said, unless you happen to have some hitherto unseen quote handy, is that the 5-year running mean of global surface temperatures has been flat for a decade. Do you know what a decade before 2013 is? (Hint, it's not 1998.) And...
"Indeed, the current standstill of the 5-year running mean global temperature may be largely a consequence of the fact that the first half of the past 10 years had predominately El Nino conditions, while the second half had predominately La Nina conditions (Nino index in Fig. 1 [reproduced below]). Comparing the global temperature at the time of the most recent three La Ninas (1999-2000, 2008, and 2011-2012), it is apparent that global temperature has continued to rise between recent years of comparable tropical temperature, indeed, at a rate of warming similar to that of the previous three decades. We conclude that background global warming is continuing, consistent with the known planetary energy imbalance, even though it is likely that the slowdown in climate forcing growth rate contributed to the recent apparent standstill in global temperature."
http://www.columbia.edu/~jeh1/mailings/2013/20130115_Temperature2012.pdf
ENSO.jpg
 
It is a very simple calculation on an Excel spreadsheet to find out the earliest date from which the slope of temperature change to the present is zero or less. Using the latest HADCRUT4 data set it turns out to be November 2000. Prior to that date, they are all positive. Since 1850 the slope is a positive 0.0046 per year which adds up to a 0.75°C rise in temperature since that date. Since November of 2000 (2000.83) the slope is a negative -0.00020 which adds up to a drop in temperature of minus -0.0025 since then. The 2013.08 anomaly would have to have been at least 0.86 before that earliest date becomes more recent. Here are the pertinent rows from my Excel spreadsheet:

row#; yyyy.xx; anomaly; slope
...
0001; 1850.00; -0.695; 0.0046
...
1811; 2000.75; 0.209; 0.00063
1812; 2000.83; 0.151; -0.00020 [=SLOPE(B1811:B$1958,A1811:A$1958)]
...
1957; 2013.00; 0.432; 0.60
1958; 2013.08; 0.482

What does it mean?
Temperatures have been flat since November 2000.

[Posted over at Open Mind' and they tell me, "Your comment is awaiting moderation." we'll see how open they are. ]
Well done, Steve, glad to see you're still trying to keep the numbers honest.
 
Steve Case said:
Here are the pertinent rows from my Excel spreadsheet:

row#; yyyy.xx; anomaly; slope
...
0001; 1850.00; -0.695; 0.0046
...
1811; 2000.75; 0.209; 0.00063
1812; 2000.83; 0.151; -0.00020 [=SLOPE(B1811:B$1958,A1811:A$1958)]
...
1957; 2013.00; 0.432; 0.60
1958; 2013.08; 0.482

What does it mean?
Temperatures have been flat since November 2000.

[Posted over at Open Mind' and they tell me, "Your comment is awaiting moderation." we'll see how open they are. ]

Well done, Steve, glad to see you're still trying to keep the numbers honest.

I suppose if you can't beat them with brilliance, you can always try to baffle them with bull****. You don't even understand all that, do you Earthling? I certainly don't, so at best it's an exceptionally poor attempt to convey some lofty information which even the scientists have missed. At worst, you are dutifully clapping along to something you don't understand: Someone tells you temperatures have been flat since November 2000 and you're there as the ever-dependable cheerleader.

Even though the hottest years on record were 2010 and 2005.
Global surface temperature - Met Office
 
Last edited:
I suppose if you can't beat them with brilliance, you can always try to baffle them with bull****. You don't even understand all that, do you Earthling? I certainly don't, so at best it's an exceptionally poor attempt to convey some lofty information which even the scientists have missed. At worst, you are dutifully clapping along to something you don't understand: Someone tells you temperatures have been flat since November 2000 and you're there as the ever-dependable cheerleader.

Even though the hottest years on record were 2010 and 2005.
Global surface temperature - Met Office
I provided enough information so that anyone with a modest amount of Excel ability can duplicate what I did. You want to call that B.S.

The point isn't whether Earthling understands it, it's whether or not you understand it.
 
I suppose if you can't beat them with brilliance, you can always try to baffle them with bull****. You don't even understand all that, do you Earthling? I certainly don't, so at best it's an exceptionally poor attempt to convey some lofty information which even the scientists have missed. At worst, you are dutifully clapping along to something you don't understand: Someone tells you temperatures have been flat since November 2000 and you're there as the ever-dependable cheerleader.

Even though the hottest years on record were 2010 and 2005.
Global surface temperature - Met Office

Like I said UAH satellite data is not be influenced by Urban Heat Island effect whereas surface data will. It is why I consider it the most reliable for making such determinations. Frankly its all just of mildly academic interest given our truly accurate satellite record goes back only 35 years and surface records have been so 'fiddled' as to be next to worthless. In other words our reliable records are only good for determining the fact we have had a modest warming phase just like dozens of others since the last glaciation. There is nothing remarkable about todays temperatures in either their level nor rate of change as has been illustrated dozens of times already
 
Another flamebait thread rehashing the same old same old despite the reality of the pause having been acknowledged by even the likes of James Hansen :roll:

...and Trenberth,and Jones, and Schmidt and Mann.

These guys have wisely figured out it only makes you look like a fool if you don't acknowledge the obvious.
After all, you can't criticize the other side for ignoring obvious data when you do the the same.

So a more honest approach. It's paused. We're not exactly sure why . We think it is only temporary.
Of course that comes with a risk. It implies that science is NOT settled ( which it most most assuredly is not).

Since this whole global warming thing has always been more about politics than about science, I am not confident honesty will ultimately prevail with these folks
 
Last edited:
I wrote earlier:
Posted over at Open Mind' and they tell me, "Your comment is awaiting moderation." we'll see how open they are.

And they are not very open, my comment apparently didn't pass moderation.
 
You mean the guy who supposedly modifies temperature data to fit an agenda?

Why wouldn't he instead... you know... modify the temperature data, so there's no pause? :roll:


What he actually said, unless you happen to have some hitherto unseen quote handy, is that the 5-year running mean of global surface temperatures has been flat for a decade. Do you know what a decade before 2013 is? (Hint, it's not 1998.) And...
"Indeed, the current standstill of the 5-year running mean global temperature may be largely a consequence of the fact that the first half of the past 10 years had predominately El Nino conditions, while the second half had predominately La Nina conditions (Nino index in Fig. 1 [reproduced below]). Comparing the global temperature at the time of the most recent three La Ninas (1999-2000, 2008, and 2011-2012), it is apparent that global temperature has continued to rise between recent years of comparable tropical temperature, indeed, at a rate of warming similar to that of the previous three decades. We conclude that background global warming is continuing, consistent with the known planetary energy imbalance, even though it is likely that the slowdown in climate forcing growth rate contributed to the recent apparent standstill in global temperature."
http://www.columbia.edu/~jeh1/mailings/2013/20130115_Temperature2012.pdf
View attachment 67161175


This is an important distinction, but I am guessing you don't know why. Arbitrary start and end points are always a problem with trend analysis. But tell me... why has the AGW team chosen to measure the global temperature trend starting from the mid 1800s?
 
I suppose if you can't beat them with brilliance, you can always try to baffle them with bull****. You don't even understand all that, do you Earthling? I certainly don't, so at best it's an exceptionally poor attempt to convey some lofty information which even the scientists have missed. At worst, you are dutifully clapping along to something you don't understand: Someone tells you temperatures have been flat since November 2000 and you're there as the ever-dependable cheerleader.

Even though the hottest years on record were 2010 and 2005.
Global surface temperature - Met Office
I don't need to understand it, I know Steve has a good record in that area and that he wouldn't post anything that could be shot down.

Are you simply annoyed because you don't understand it?

Be happy that the puppy liked your post.
 
I wrote earlier:
Posted over at Open Mind' and they tell me, "Your comment is awaiting moderation." we'll see how open they are.

And they are not very open, my comment apparently didn't pass moderation.
Maybe it's being checked for accuracy by the Tamino science team. Ö¿Ö
 
I'm sure it's exasperating for scientists who see their words and work cherry-picked for denier fodder.
Warming?[/url]

“The 1997 to ’98 El Niño event was a trigger for the changes in the Pacific, and I think that’s very probably the beginning of the hiatus,”
-Kevin Trenberth

I can absolutely imagime how frustrating it must be for Keven Trenberth when he sees people claim there is no hiatus.
He must think" DUHHHHHHHHHHH, can't you maroooons look at a simple graph".
 
I'm sure it's exasperating for scientists who see their
words and work cherry-picked for denier fodder.

Here's an article and nasa climatologist explaining
the slowdown, not stoppage, in warming:

Global Warming 'Pause' Isn't What Climate Change Skeptics Say It Is - weather.com

Goddard Multimedia Item 11380 - Ask A Climate Scientist - a Pause in Warming?
In the second link, Dr. Josh Willis says:

Look at the sea level record for the last decade.
It's going up like gangbusters, hasn't slowed down.
He's absolutely correct, I checked it out, with this data:
http://sealevel.colorado.edu/files/2013_rel8/sl_ns_global.txt
from Colorado Universtiy's Sea Level Research Group.

A 2nd order polynomial trend shows a pronounced curve
upwards and the rate of sea level rise is 2.8 mm/yr for the
last decade.

However, if he used all the data back to 1993 not just the last
decade, he would find that it has slowed down. The rate of
sea level rise for the first decade of that data is 3.5 mm/yr.

Not to put to fine a point on it, Dr. Josh Willis engaged in
some cherry picking.

On Edit:

I went back to see what blog Dr. Willis was using for that
bit of cherry picking, and I find that it's a dot gov web site.
He's using my tax dollars to spread bad science.

I am not happy about that.
 
Last edited:
Another flamebait thread rehashing the same old same old despite the reality of the pause having been acknowledged by even the likes of James Hansen :roll:

Poor liitle guy's in a box . Every other post he's caliming how Nature is the grand oracle of science , but now that Nature has an article saying ther'e a pause in global warming, what to do.

He's constantly reminding us all how the Trenberth ,Mann, Hansen, Schmidt 's are the one's we should all go to for our climate science info, but they all say there's a pause in global warming. What to do?

New rules, I guess.
Disregard Nature, Trenberth, Schmidt, Hansen and Mann,
. The new Oracle of knowledge is an anonymous internet blogger.
( named Grant Foster btw)
 
Actually I'm on the side of the warmers in this one. I believe the Earth is warming, pretty much normally and consistently over thousands of years--I don't believe we can base any conclusive trend on recent history, certainly not for the limited number of years we have had satellite records--as always happens in the period following an ice age. But the globe will continue to pass through cycles, ebb and flow, cooling and warming, with the ultimate overall trend to be warming.

And we can be really really happy that is the case because, so long as the overall trend is warming, we are unlikely to be rapidly entering another ice age that many scientists believe we are overdue to have. Maybe if anthropologically produced CO2 is contributing to warming in an any significant way, we should encourage more of it to hold off the next ice age that is inevitable. The paleontological record assures us that the Earth has been much warmer overall than it is now and life on a lush Earth thrived in those periods. Such warm periods are not something we necessarily need to fear. We might even be wise to embrace them.

We should be worried at such time as there is a confirmed long term cooling trend however, as ice ages, even the mini types we have recorded in the past, have not been good for man nor beast on Planet Earth.
 
Back
Top Bottom