• This is a political forum that is non-biased/non-partisan and treats every person's position on topics equally. This debate forum is not aligned to any political party. In today's politics, many ideas are split between and even within all the political parties. Often we find ourselves agreeing on one platform but some topics break our mold. We are here to discuss them in a civil political debate. If this is your first visit to our political forums, be sure to check out the RULES. Registering for debate politics is necessary before posting. Register today to participate - it's free!

Noted Economist Explains What Is Really Driving Inflation

Yes...you did.

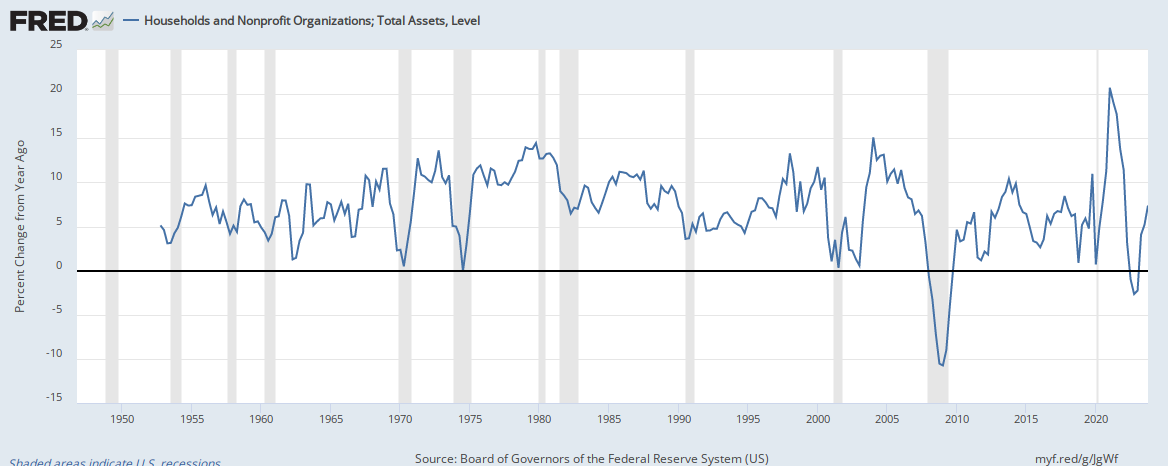
You posted the following about the chart below:

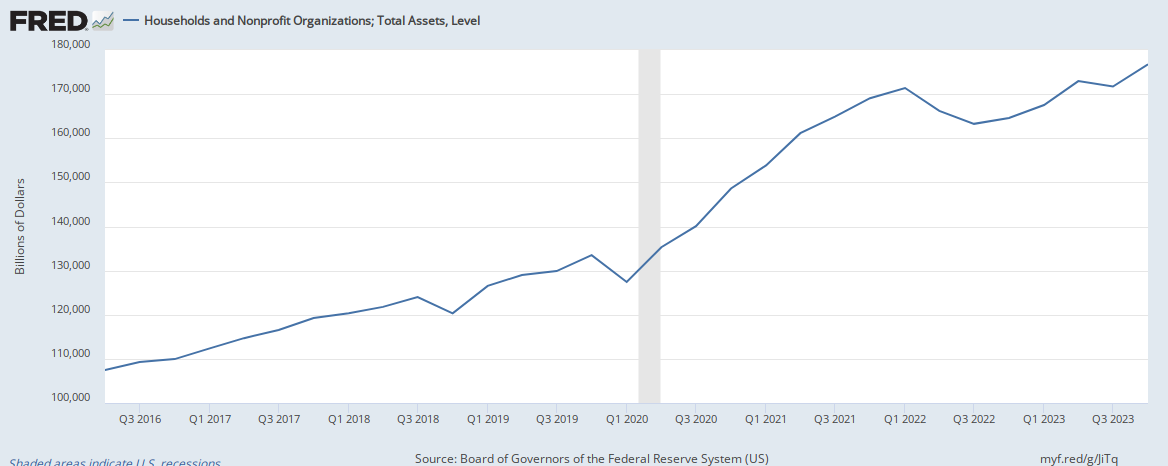
'Asset valuation levels grew by 20% in the first quarter of 2021 alone:'

fredgraph.png


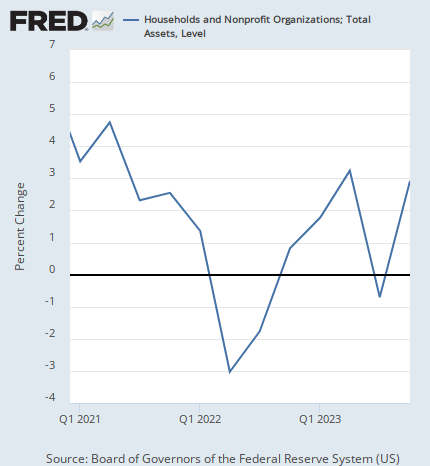
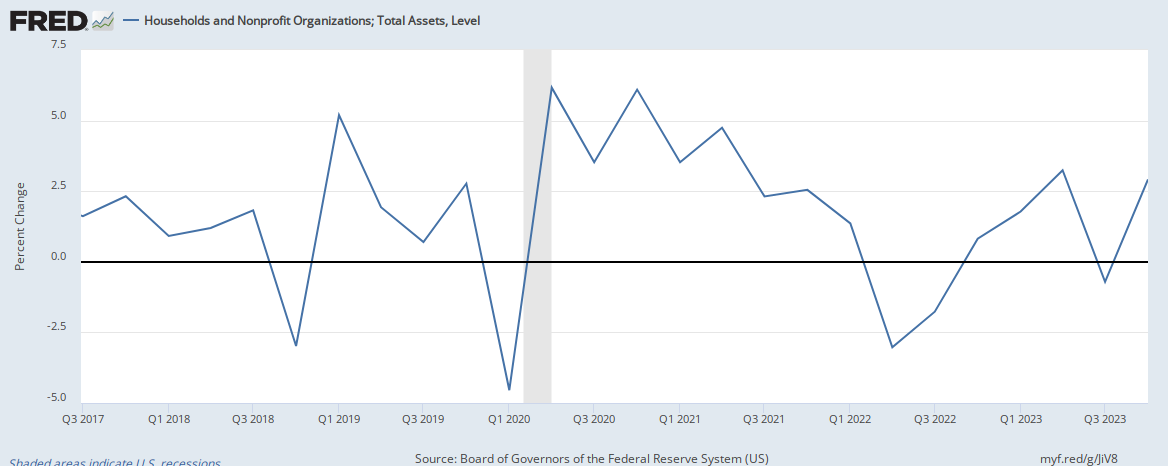
But the chart only measures 'Percent Change from Year Ago'?
But you obviously read it and thought it meant 'percentage change per quarter'.

First you post a chart that you obviously did not even understand (fair enough - it happens).
But then you do not even have the honesty and integrity to admit that you did it.
 
2016 was a long time ago.
Fine.
This link shows that the middle class (50'th-99'th percentile) have a lower percentage of America's total wealth now then they did in 2016.
So if anything - it has gotten worse.
But going into the end of 2021 the economy is objectively pretty great. There's 4% unemployment. Employers cannot hire enough people fast enough. It's the easiest environment in the last couple of decades to get a job. Consumption is up, demand is up, wages are up, stocks are up.

We're seeing big increases in spending power among the lower income groups. Hence inflation. No matter how much money rich people get, they aren't going to go clean out a Walmart. Part of that is supply interruptions, but a good part of that is just increased consumption. People in the lower income groups are doing better.
And despite 'all this'?
The wealth gap keeps growing, consumer confidence keeps falling,
united-states-consumer-confidence.png

tradingeconomics.com/united-states/consumer-confidence

Plus personal consumer debt last quarter was a record and the economy - despite TRILLIONS of dollars thrown at it - has averaged well under 3% Real GDP since the Great Recession.
And the equity rise?
Benefits the wealthy almost entirely (hence the lower classes losing ground in the wealth gap).
The national debt has exploded and inflation is the highest in a generation.

And the U-3?
Means nothing.
It does not count unemployed people who gave up looking for work.
Which is nonsense as they are still unemployed...they just cannot find a job.

The Employment-population ratio is what you should be watching.
And I said the SAME thing when Trump was in power.

The economy IS FANTASTIC for the wealthy.
Lousy for almost everyone else.
 
And the U-3?
Means nothing.
It does not count unemployed people who gave up looking for work.
Which is nonsense as they are still unemployed...they just cannot find a job.
They can’t find a job because they’re not looking for a job. The unemployment rate is the percent of available labor not being used. People not trying to work couldn’t be hired even if there were jobs for them, so they tell us nothing about how relatively easy or difficult it is to find work.
The Employment-population ratio is what you should be watching.
Ok, the E/P ratio is currently 58.8% (of those in the US excluding children under 16, active duty military, prisoners, and those in long term health facilities)
So that’s 41.2% of those theoretically free to work who are not working. Except 36% of the population do not want a job. So that’s no help in evaluating the job market.

There are 161,458,000 people working or trying to work. 7,419,000 failed to find work from mid September to mid October. That tells us the difficulty of finding work. That people who didn’t try to find work didn’t find work tells us nothing.

And I said the SAME thing when Trump was in power.
And you were wrong then, too.
 
How do you think the management of the pandemic was wrong?
I do as well.
But I am just wondering in what way you think it was wrong.
(I promise I will tell you what I think if you tell me)
In the US the captains of capital decided to leverage it as a eugenic cleansing exercise once they knew they could no longer deny it was a thing, which they did at first as the substantial people rearranged their stock portfolios.
 
Fine.
This link shows that the middle class (50'th-99'th percentile) have a lower percentage of America's total wealth now then they did in 2016.
So if anything - it has gotten worse.

And despite 'all this'?
The wealth gap keeps growing, consumer confidence keeps falling,
united-states-consumer-confidence.png

tradingeconomics.com/united-states/consumer-confidence

Plus personal consumer debt last quarter was a record and the economy - despite TRILLIONS of dollars thrown at it - has averaged well under 3% Real GDP since the Great Recession.
And the equity rise?
Benefits the wealthy almost entirely (hence the lower classes losing ground in the wealth gap).
The national debt has exploded and inflation is the highest in a generation.

And the U-3?
Means nothing.
It does not count unemployed people who gave up looking for work.
Which is nonsense as they are still unemployed...they just cannot find a job.

The Employment-population ratio is what you should be watching.
And I said the SAME thing when Trump was in power.

The economy IS FANTASTIC for the wealthy.
Lousy for almost everyone else.
Increases in american worker productivity and pay/wages/reward/compensation were divorced one from the other in the 1970's. And the captains of capital never looked back. I find it hilarious hearing the "job creators" moan about no one wanting to work anymore.

 
They can’t find a job because they’re not looking for a job. The unemployment rate is the percent of available labor not being used. People not trying to work couldn’t be hired even if there were jobs for them, so they tell us nothing about how relatively easy or difficult it is to find work.
Wow?
What an insult you just laid on all discouraged workers.
There are a near, infinite number of reasons why discouraged workers gave up looking.
Not just because they 'couldn't be hired'.

Ok, the E/P ratio is currently 58.8% (of those in the US excluding children under 16, active duty military, prisoners, and those in long term health facilities)
So that’s 41.2% of those theoretically free to work who are not working. Except 36% of the population do not want a job.
The BLS added for people whom 'Do not want a job now':
'Includes some persons who are not asked if they want a job, such as passive jobseekers.'

So the stat is useless as we have no idea how accurate it is.

So that’s no help in evaluating the job market.
So?
You are calling the Employment-Population Ratio 'no help in evaluating the job market'?
You just proved that you do not know what you are talking about on this.
Every economist (should) know that NO consistently, tabulated statistic offers 'no help'.

And you were wrong then, too.
Wrong.

The Employment-Population Ratio both today and just before the 'Covid Depression' were both lower than they were just before the Great Recession began.


That shows that the employment situation is still worse now AND in late 2019 than it was before the Great Recession began?
And the Real GDP has averaged far below 3% since the end of the Great Recession.

This despite 14 years of ZIRP, QE and about $22 Trillion dollars thrown at the economy (in debt and the Fed).
The economy is a mess.

If you cannot see that?
Whatever.


I am done with you on this.

First you insult tens of millions of American 'discouraged workers' by that smart ass remark of yours.

(if you had a decent amount of integrity? You would apologize to all American Discouraged Workers for that EXTREMELY, insensitive and derogatory comment. But I am guessing you won't)
Then you say the Employment-Population Ratio offers 'no help in evaluating the job market'.
Not little or some or partial...'no help'?!?
Which is miles beyond 'erroneous'.


Bye now.
 
Last edited:
Nope. You're trying to play gotcha. It won't work.

The first quarter had annualized growth of more than 20%.

You don't want to have a discussion. Pedantic bullshit is the best you have to offer.
Oh for Goodness sake...

In Q4 2020 - the Total Assets were $147.8 (trillion).
In Q1 2021 - the Total Assets were $153.1 (trillion).
That is a rise of $4.3 (trillion).
That is 2.9%.
NOT 20%.

(but it was 20% between Q1 2020 and Q1 2021)

You got it yet?


fredgraph.png


You read the frigging, chart wrong.

Just be a man, admit your mistake and let's move on.
Sheesh!!!
 
Oh for Goodness sake...

In Q4 2020 - the Total Assets were $147.8 (trillion).
In Q1 2021 - the Total Assets were $153.1 (trillion).
That is a rise of $4.3 (trillion).
That is 2.9%.
This is why you lose the gotcha game:
fredgraph.png


Go hump some someone else's leg.
 
This is why you lose the gotcha game:
fredgraph.png


Go hump some someone else's leg.
You are right in that I did my quick math wrong.
Sorry.

As you can see in my link.
I got 4.3 trillion.
When it was really $5.3 trillion.

So it was not 2.9%.
It was really 3.6%.
(though that is still MILES from the 20% you claim)

Here is a larger version of the chart you posted:
fredgraph.png


Of course?
You realize you just posted a chart that 100% proves that your statement that the Q1 2021 rise was 20% was erroneous?

You keep shooting yourself in the foot.
You JUST - yet again - proved that you read the chart wrong before.


See how I admitted I made a subtraction mistake?
No biggie.
Now let's see if you can show the world that you can be a man too and admit that you misread the chart you posted?
(somehow - I doubt it...STRONGLY)
 
I don't care.
I doubt that.

Now...this is the chart that YOU posted.

fredgraph.png


Now...does it show that Total Assets went up by about 20% in Q1 2021 (as you stated before)?
Or does it show that they went up less than 4%?
 
Wow?
What an insult you just laid on all discouraged workers.
There are a near, infinite number of reasons why discouraged workers gave up looking.
Not just because they 'couldn't be hired'.
Wow. Let me rephrase, so you can understand what I actually said, and then apologize to me.

If someone is not looking for a job…is not applying for any jobs…then no employer will know they are available, and they will not be aware of any available jobs. Therefore, they could not be hired, regardless of whether any jobs were actually available. The perfect job for that person could be available, but s/he wouldn’t know and the employer wouldn’t know about the person.

In no way was I saying that discouraged workers would be unsuccessful if they stopped being discouraged and applied for a job.

Your interpretation is so bizarre, I’m not even sure it was an honest misinterpretation. How could you even think that a person not trying to find a job could be hired?
 
The BLS added for people whom 'Do not want a job now':
'Includes some persons who are not asked if they want a job, such as passive jobseekers.'

So the stat is useless as we have no idea how accurate it is.
I’m not following your logic. Passive job searchers (those whose job search could not result in actually getting a job) are not in the labor force but it is assumed that they do want a job, which is why they’re not asked. I don’t know what you mean by “added” or which statistic you think is inaccurate because of that.
So?
You are calling the Employment-Population Ratio 'no help in evaluating the job market'?
You just proved that you do not know what you are talking about on this.
Every economist (should) know that NO consistently, tabulated statistic offers 'no help'.
I did NOT say the employment-population was entirely useless, I said it was no help in looking at the LABOR MARKET. The E/P ratio tells us what percent of the population is economically active and supporting the rest of the population. That is useful, especially in conjunction with stats specifically about the job market. But it doesn’t tell us about people succeeding or failing to find work, because it doesn’t tell us how many want or are able to work.

Go back to the 1950’s when the economy was booming and note that the employment/population ratio was a lot lower than it was during any of the recessions from the 1970’s on, even though the economy was better.


First you insult tens of millions of American 'discouraged workers' by that smart ass remark of yours.

As previously explained, no, I did not. And there are only 450,000 discouraged workers


if you had a decent amount of integrity? You would apologize to all American Discouraged Workers for that EXTREMELY, insensitive and derogatory comment. But I am guessing you won't)

If you had any integrity, you wouldn’t have deliberately exaggerated the number of discouraged workers by orders of magnitude and you wou would apologize for insulting me over your misunderstanding of my words.
 
why do you think you can make shit up and get away with it? Do you actually think you can lie about the economy, inflation and every other moronic thing you posted, and nobody will notice?
Just the truth. The economy sucks, Biden sucks, and the people who voted for him are the one's we have to thank.
 
Just the truth. The economy sucks, Biden sucks, and the people who voted for him are the one's we have to thank.
:ROFLMAO::ROFLMAO::ROFLMAO::ROFLMAO:
 
Not spending $6T trying to buy votes.


Not accepting your $6T figure, but better spending money to buy votes that goes to helping the middle class and those with less than spending money to buy big $ donors and help the uppermost class and large corps make more money than they need to further accumulate wealth without them lifting a finger for it, except for future donation.
 
Not accepting your $6T figure, but better spending money to buy votes that goes to helping the middle class and those with less than spending money to buy big $ donors and help the uppermost class and large corps make more money than they need to further accumulate wealth without them lifting a finger for it, except for future donation.
So you admit its buying votes. Progress.
 
How do you not get embarrassed when you post such moronic and demonstrably incorrect shit?
When will liberals understand that denying the truth does not change the facts? But then again, if they could distinguish reality from fantacy, they would not be headuptheirass liberals...
 
I’m not following your logic. Passive job searchers (those whose job search could not result in actually getting a job) are not in the labor force but it is assumed that they do want a job, which is why they’re not asked. I don’t know what you mean by “added” or which statistic you think is inaccurate because of that.

I did NOT say the employment-population was entirely useless, I said it was no help in looking at the LABOR MARKET. The E/P ratio tells us what percent of the population is economically active and supporting the rest of the population. That is useful, especially in conjunction with stats specifically about the job market. But it doesn’t tell us about people succeeding or failing to find work, because it doesn’t tell us how many want or are able to work.

Go back to the 1950’s when the economy was booming and note that the employment/population ratio was a lot lower than it was during any of the recessions from the 1970’s on, even though the economy was better.

As previously explained, no, I did not. And there are only 450,000 discouraged workers

If you had any integrity, you wouldn’t have deliberately exaggerated the number of discouraged workers by orders of magnitude and you wou would apologize for insulting me over your misunderstanding of my words.
AVvXsEixWsYEMBli0k_DHqXs2Z-UzRiTjBWb3M0xYeAWwG9nKVtBmBiiw59l5bdUa7GYH-jkV9G-eroTPNw1LKBVTF9GkU1Oro6whec8O_yFy_vGRebAUqSsmCpyluP2ToQ9RXDF_bCw-2EBuI90KNZ5X7JG6CNJ-upPAj9q7XDmBXfMonqiBoZCQw
 
Because they went around bank lending and gave it away. Stimulus checks?

Your statement lacks a grasp on reality and therefore lacks merit.
So, your theory is that people have too much money? Supply shortages played no part?
 
So, your theory is that people have too much money? Supply shortages played no part?
Demand was higher than supply BEFORE the shortages. Spending way up, I believe I linked a graph earlier.
 
Demand was higher than supply BEFORE the shortages. Spending way up, I believe I linked a graph earlier.
You're missing the point:

fredgraph.png


Pandemic consumption patterns point to goods consumption growth well in excess to services consumption. These expenditures grew in a similar band for quite some time. People are spending more time at home, buying more things that they use in a way to substitute for services like food, travel, and entertainment.
 
Back
Top Bottom