• This is a political forum that is non-biased/non-partisan and treats every person's position on topics equally. This debate forum is not aligned to any political party. In today's politics, many ideas are split between and even within all the political parties. Often we find ourselves agreeing on one platform but some topics break our mold. We are here to discuss them in a civil political debate. If this is your first visit to our political forums, be sure to check out the RULES. Registering for debate politics is necessary before posting. Register today to participate - it's free!

Are We the Greatest, Richest Country in the World?

Unfortunately over simplified measures graphed can skew the perspective. A litmus test certainly, but one that needs to be looked at in detail and explained to be understood. Lots of things that effect it from aging population, earners, buying power, more single households…

So adjusted for inflation: 1960 middle class:
$28,500-$84,000 [68%] -> [41% Today]

Today it's
$41,500-122,000 [45%] [sounds bad, but controlled for population growth we've added not substracted people to the middle class since 1960]

With todays middle class range, 47% of those households are duel income. 36% being university educated[46% of total graduates]. Those below: 69% worked part-time and below and 48% were single person households. In the middle class range only 21% of households were single person and 35% worked part-time or below.

My point being. Economically the average family has still been improving even with those negative factors like increase in dual incomes. 80% of American married families are middle class and above, 93% above 1960 cut off. Those below the middle class are majority non-family households and a poor comparison without accounting for some of the factors of why they are there.

In other words:
50% of seniors are below middle class. 65% of single person households. 76% of no earners. 58% of those that didn't work. 40% of those who worked only worked part-time. I would also note 50% of these with these low-incomes are still home owners.

When you control the worst year in post-WWII American History it was early 1980s.

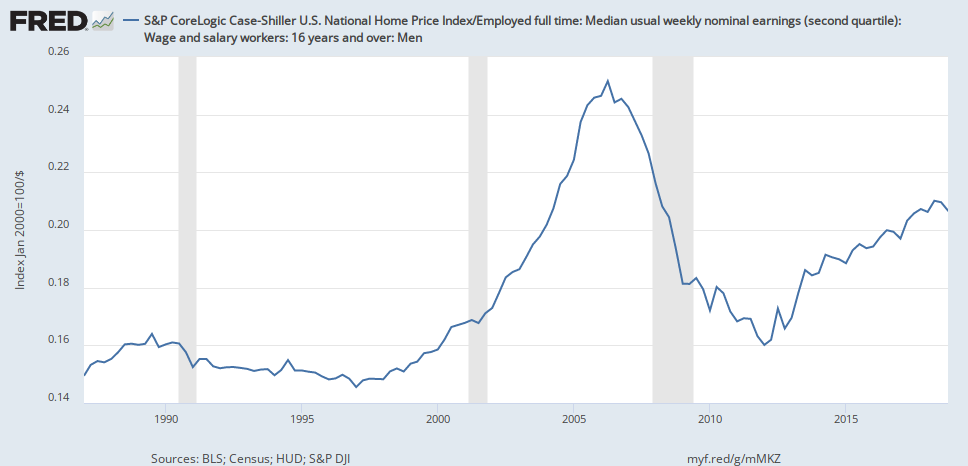
The problem is that you're considering inflation to be the cost of living. There's just one problem: the cost of living has outpaced inflation.

Inflation-of-goods-services-.jpg


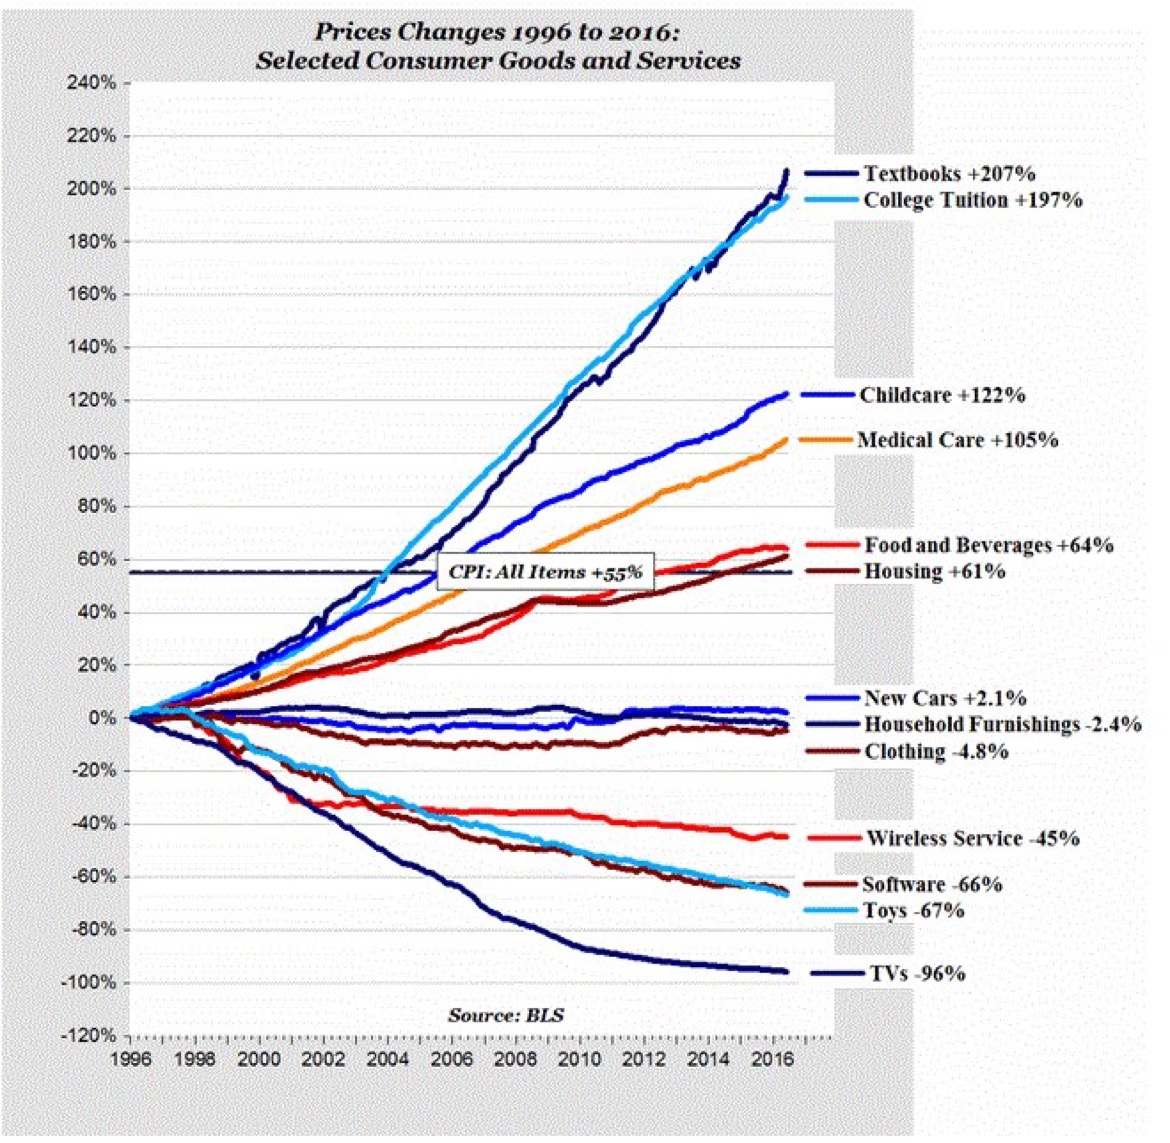
The necessities of life are more expensive, while the toys have become cheaper. That is, the necessities of life were cheaper for those living in the 60s than for the middle class today.

Most opportunities require tech literacy not an advanced education. Tech litercy is freely available via the internet.

That said, I also am also concerned at the trends for both spouses to working and children not getting proper parenting and community. The divorce rate, single partent homes, abortion, debt, drug use, environmental impact, obsiety, depression, non-violent crimnality, no entry level jobs for young adults....

We are far from an ideal or have not progressed without costs. Debt remains the hardest factor to compare and contrast and may including public and private well cancel out all the above stated gains. How do you suppose we account for it though? At this point the public debt falls 90% burden falls on predominately duel income families in the top incomes not equally. Majority of middle class rarely even pays current equal tax bill and carries the majority of the burden in terms of private debt.


'Usury' restrictions, laws and regulations may be a better bet. Wage earners are often doing little else to adapt to rapid economic changes. The fact one's labour was worth x in 1960 and y rather than x+ in 2020 is mostly a result of changing market forces not non-earner manipulation. Market forces benefits are universal by nature but certainly can leave some out. The opposite to market forces is always enforced monopolization(either by public or private actors). You will never stregthen market outcomes by restricting market forces only counterbalancing natural monopolization. If you replace private 'usery' with public taxation you are only shifting the doer not attacking usury within the system.

Taxing earners less may help in the shortterm only to hurt us in the longterm. *cough* pensions *cough*

The public system is the least in check, inflation corrected taxes dollars per citizen have risen every year meanwhile benefits paid out at a much lower rate. Those connected to the top level of the public purse beign the most benefited (hence the lobby industry). It is also entirely funded by wealth transfer. So how does making 'wealth transfer' more public verse private help the average earner? The only way would be if more earner worked for the public which is just more indirect as any benefit above market is just a de-facto subsidy.

I'm not interested in making wealth transfer public versus private. I want to eliminate wealth transfer. Less debt, no debt based currency, and the end of tax subsidies for unearned income.
 
I want to eliminate wealth transfer. Less debt, no debt based currency, and the end of tax subsidies for unearned income.
I am with you with currency reform so that is good. On that "unearned" income:

Average Net-worth by age group US Census 2017:
25 to 35 years old: $6,900
35 to 44 years old: $45,740
45 to 54 years old: $100,404
55 to 64 years old: $164,498
65+ years old: $202,950

If your theory is correct we'd expect serious deterioration with pretax income being concentrated with older generation(with the more accumulated net worth)…

This is the income breakdown by age:

~Millennials: [Ages 25-34]
30% Low Income
26% Low Middle Class Income
27% Mid-High Middle Class Income
12% Upper Income
5% $200,000+

Median income: $62,294
Mean Income: $81,487

~Generation X Late [Ages 35-44]
24% Low Income
21% Low Middle Class Income
29% Mid-High Middle Class Income
16% Upper Income
10% $200,000+

Median income: $78,368
Mean Income: $101,472

~Generation X Early [Ages 45-54]
24% Low Income
20% Low Middle Class Income
26% Mid-High Middle Class Income
18% Upper Income
12% $200,000+

Median income: $80,671
Mean Income: $105,346

Late Baby Boomer [Ages 55-64]
31% Low Income
20% Low Middle Class Income
24% Mid-High Middle Class Income
15% Upper Income
10% $200,000+

Median income $58,557
Mean Income: $96,779

Early Baby-boomers and Older [Ages 65+]
49% Low Income
18% Low Middle Class Income
18% Mid-High Middle Class Income
8% Upper Income
4% $200,000+

Median income $41,125
Mean Income: $63,999

If educational was the sole factor:
10% Low Income [Less HS]
44% Low Middle Class Income [HS/some]
28% Mid-High Middle Class Income [associates/bachelors]
12% Upper Income [masters]
4% $200,000+ [profession / ph.d]

And we want to more heavily tax the only income available to the worse preforming income group seniors?

Seniors are already getting 401K's and IRA's which are tax exempt. I'm not aiming to attack small families who are trying to retire. We should have a more generous retirement system.

Further, your income figures are a bit misleading, as Baby Boomers often have the value of their home to use rather than a lot of income. We're not seriously arguing that Millenials are doing better than Boomers, are we?
 
We're not seriously arguing that Millenials are doing better than Boomers, are we?
I would argue the economic prospects and purchasing power for those aged 25-34 in 2020 are better than any generation of similar age previous. And yes, millennials are doing quite well despite the political narrative things are worse. Culturally is a far differnt story. The numbers right now though headed our way. Prepare, as things are about to change....

The most important aspect of that data though should be Baby Boomers are those struggling in the key income metrics(i.e. affording their lviing costs) and the least affected by tax changes and programs to tax wealth. They also relay the most on passive income not the young families you aim to help. They still have the highest degree of accumulated wealth and the slowest growth[opposite of your theory]. More, that 'unearned' income theory is not seen in general trends either. The difference seen easily accountable by increases in experience with a drop of 55 due to retirement or health concerns.

There two main aspects that are actually concerning to the younger generations: Debt(private and public) & Government Mismanagement.

In 1960 there were 52.8 M households. 16.5 million Seniors 1:3.2.

Government brought in:
Fed[63%],State[18%],Local[19%]Transfer[5%]:
Collected: $146 Billion
Spent:$151 Billion
Debt: $292 Billion (2x Tax Revunues)

per household:
Collected: $2,765
Spent:$2,860
Debt: $5,530

2018 Dollars:
Collected: $22,897 / household
Spent:$23,683 / household
Debt: $45,794 / household

In 2017, there were 127.5 M household. 50.8 Million Seniors. 1:2.5.

Fed[54%],State[24%], Local[20%],Transfer[10%]:
Collected: 6.1T
Spent: 6.9 T
Debt: 21 T (3.4x Tax Revunues)

per household:
Collected: $47,810 [108% over inflation]
Spent:$54,081
Debt: $164,594

The top 5% of income makers[92% dual income families!] has doubled their hold of the total income from 1960, but tripled their contribution towards this higher tax burden. In other-words, the tax rate is down for the majority despite these massive increases in spending and collections.

All and all, I'll tell you want I see. I see the need for one thing: a grown-up to bring the public financial house in order. Baby-boomers never paid for their services they received! They failed to balance their private and public books, their numbers are awful, and they left a hefty debt(private and public), they deserve zero help now they are the bottom incomes and will continue to be as we approach the big drop in 2030…programs such as you proposed for 'low income' are too costly. Monetary reform alone lucky to reduce the deficient let alone reverse the trend of the debt[it's at the 250 year level]. Student loans for example are evil, forginveness would be wonderful but we can't afford it [on our current path] and the year avg return on that investment went up by 287% per year since 1960 (difference of mean univeristy incomes to non-univerity). So generally speaking it will be paid off even at the inflated cost - awful for those who got the wrong education but that's investment for you.

You can try to spend more money we don't have, or try to take more of mine - but if I were you I'd start discussing how to move medicare and old age into an affordable entilement package cause it on a fast track to getting cut hard, that improtant senior ratios is about to go up not down and the next wave of seniors are not preped to retire or work. Intrest rates will not always be low. I tell you this, your worried about the 40% of houses that are more expensive now [peak 1980 at 92% of houses: balance prime rate + cost/sqft + regional variation] - seniors are about to dump those to survive. Their pensions and government back promises an unpaid unsustainable pipe dream. I don't want more poor seniors but that's about to happen - what are we going to do? :confused:
 
Last edited:
Forget statistics.

Of course, the United States of America is currently the greatest and the richest nation in the world (and in history).

In another 100 years, however, it will no longer deserve that title. It will be listed as just another failed state.
 
I ran across this post recently:


And I wanted to look up some statistics to see how valid this claim was. What I found was shocking.


Frankly, I don't know if there is a response you can make to that last image. Typical American wealth is behind what you see in advanced European economies, advanced Asian economies, but also European basket cases! This is a big gap in many cases. While our median wealth is around $50k, France has a median wealth greater than $90k, so does Canada.


So taken as a whole our nation may be the richest, but for most Americans this certainly isn't the case. They're not experiencing the benefits of this economy.

Make of this what you will, but I hope that this dispels the notion that we are the greatest economy ever and everything is just grand! It's not, and I'm sick of "CAPITALISM FTW!!!" tier arguments.

https://www.credit-suisse.com/corporate/en/research/research-institute/global-wealth-report.html
<snip>
The Global Wealth Report 2018


The ninth edition of the Global Wealth Report published by the Credit Suisse Research Institute provides the most comprehensive and up-to-date source of information available on global household wealth.

During the twelve months to mid-2018, aggregate global wealth rose by $14.0 trillion (4.6%) to a combined total of $317 trillion, outpacing population growth.

Wealth per adult grew by 3.2%, raising global mean wealth to a record high of $63,100 per adult.

The US contributed most to global wealth adding $6.3 trillion and taking its total to $98 trillion.

This continues its unbroken run of growth in both total wealth and wealth per adult every year since 2008.

Unsurprisingly, China is now clearly established in second place of the world wealth hierarchy.

The country overtook Japan with respect to the number of ultra-high net worth (UHNW) individuals in 2009, total wealth in 2011 and the number of millionaires in 2014.
<snip>
The US is a strong economy. However, the fact that we are so low when it comes to median tells us that most Americans aren't sharing in the benefits of the strong economy.

Sent from my phone. Instaurare omnia in Christo.
 
I would argue the economic prospects and purchasing power for those aged 25-34 in 2020 are better than any generation of similar age previous. And yes, millennials are doing quite well despite the political narrative things are worse.

I'll get to the rest of your post in a little while, but first there's this. This is a spectacular claim that flies in the face of everything that I presented. I'm going to need you to back this up, taking into account home prices, health care costs, and debt.

Sent from my phone. Instaurare omnia in Christo.
 
I ran across this post recently:


And I wanted to look up some statistics to see how valid this claim was. What I found was shocking.


Frankly, I don't know if there is a response you can make to that last image. Typical American wealth is behind what you see in advanced European economies, advanced Asian economies, but also European basket cases! This is a big gap in many cases. While our median wealth is around $50k, France has a median wealth greater than $90k, so does Canada.


So taken as a whole our nation may be the richest, but for most Americans this certainly isn't the case. They're not experiencing the benefits of this economy.

Make of this what you will, but I hope that this dispels the notion that we are the greatest economy ever and everything is just grand! It's not, and I'm sick of "CAPITALISM FTW!!!" tier arguments.

When your goal is “Give me your tired, your poor, your huddled masses yearning to breathe free.” this is the result.
 
I ran across this post recently:


And I wanted to look up some statistics to see how valid this claim was. What I found was shocking.


Frankly, I don't know if there is a response you can make to that last image. Typical American wealth is behind what you see in advanced European economies, advanced Asian economies, but also European basket cases! This is a big gap in many cases. While our median wealth is around $50k, France has a median wealth greater than $90k, so does Canada.


So taken as a whole our nation may be the richest, but for most Americans this certainly isn't the case. They're not experiencing the benefits of this economy.

Make of this what you will, but I hope that this dispels the notion that we are the greatest economy ever and everything is just grand! It's not, and I'm sick of "CAPITALISM FTW!!!" tier arguments.

Also, if you look at healthcare(which is one aspect of measuring happiness)…….easier to get care the more happy you are...…….we are just behind Costa Rica. Like 38th or so. Our healthcare is behind a third world country.
 
You doubt what I post because it destroy your Leftist BS
Almost impossible to do accurate comparisons like this. These type of comparisons are usually done by Leftists trying to diminish America. They use numbers provided by corrupt governments or apples to oranges comparisons.
When ever you hear that the US has the highest infant mortality rate keep in mind that we are almost the only country to count premature birth in those stats. We are also the only country that counts suicides into our firearm death stats. Also almost no other country counts accidents into their life expectancy stats.
I do know one thing:
I'm in a very specific high skilled blue collar trade, with it I can afford a fairly large house, newer truck and a motorcycle and my wife has a newer car. This is about the typical economic level of any American in my profession.
My exact professional Scandinavian counterpart almost never has a car of his own and usually lives with his entire family in an apartment about the size of my master bedroom.
I did some further checking and I found that most the rest of Europe is even worse than any of the Scandinavian countries.

So large, well funded, academic studies by professionals, you reject because you don't like them.

But a personal anecdote, with no rules shown to us, and no research...this you feel is compelling.

Yes Casca, that really destroys your argument.
 
Seniors are already getting 401K's and IRA's which are tax exempt. I'm not aiming to attack small families who are trying to retire. We should have a more generous retirement system.

Further, your income figures are a bit misleading, as Baby Boomers often have the value of their home to use rather than a lot of income. We're not seriously arguing that Millenials are doing better than Boomers, are we?

Seniors are not getting tax exempt funds from their IRAs.
401K's are subject to taxes, like an ordinary income, when distributed.
 
I'll get to the rest of your post in a little while, but first there's this. This is a spectacular claim that flies in the face of everything that I presented. I'm going to need you to back this up, taking into account home prices, health care costs, and debt.
Sounds good. I'll respond in detail when I have some time to organize the numbers.
 
The most important aspect of that data though should be Baby Boomers are those struggling in the key income metrics(i.e. affording their lviing costs) and the least affected by tax changes and programs to tax wealth. They also relay the most on passive income not the young families you aim to help. They still have the highest degree of accumulated wealth and the slowest growth[opposite of your theory]. More, that 'unearned' income theory is not seen in general trends either. The difference seen easily accountable by increases in experience with a drop of 55 due to retirement or health concerns.

As you state, Boomers have the most accumulated wealth, yet you say they're struggling. When we look at discretionary income, which group is struggling the most? It's certainly not Boomers.

This report is more than 10 years old now, but the trends haven't changed. Only the Boomers have significant discretionary income.

There two main aspects that are actually concerning to the younger generations: Debt(private and public) & Government Mismanagement.

And a low income. I've shown you that median incomes are far below what they were in the 70s.

All and all, I'll tell you want I see. I see the need for one thing: a grown-up to bring the public financial house in order. Baby-boomers never paid for their services they received! They failed to balance their private and public books, their numbers are awful, and they left a hefty debt(private and public), they deserve zero help now they are the bottom incomes and will continue to be as we approach the big drop in 2030…programs such as you proposed for 'low income' are too costly. Monetary reform alone lucky to reduce the deficient let alone reverse the trend of the debt[it's at the 250 year level]. Student loans for example are evil, forginveness would be wonderful but we can't afford it [on our current path] and the year avg return on that investment went up by 287% per year since 1960 (difference of mean univeristy incomes to non-univerity). So generally speaking it will be paid off even at the inflated cost - awful for those who got the wrong education but that's investment for you.

1. What programs have I proposed for the low income earners?
2. Student loan forgiveness doesn't cost anything. Simply cancel the debts. The debt holders will be wiped out, yes, but essentially enslaving the youth isn't an occupation that should be preserved.

You can try to spend more money we don't have, or try to take more of mine - but if I were you I'd start discussing how to move medicare and old age into an affordable entilement package cause it on a fast track to getting cut hard, that improtant senior ratios is about to go up not down and the next wave of seniors are not preped to retire or work. Intrest rates will not always be low. I tell you this, your worried about the 40% of houses that are more expensive now [peak 1980 at 92% of houses: balance prime rate + cost/sqft + regional variation] - seniors are about to dump those to survive. Their pensions and government back promises an unpaid unsustainable pipe dream. I don't want more poor seniors but that's about to happen - what are we going to do? :confused:

My monetary reform is simple. We take back the ability to create money from the banks, print our own money, and stop foolishly going into debt. Someone who owns a printing press has no business going into debt. Our interest payments are a dead weight loss.

Ending this system means that we get back the billions we're currently losing to interest payments. And the beneficiaries of this system will have to start creating real wealth instead, making our society wealthier. Have you ever seen the chart below? Look at how much of our economy is nothing but a wealth transfer, a net burden on society.

gdp-going-to-finance-insurance-and-real-estate-portion-of-national-income-as-a-percentage-of-total-goods-producing-industries-share.jpg


Sent from my phone. Instaurare omnia in Christo.
 
Seniors are not getting tax exempt funds from their IRAs.
401K's are subject to taxes, like an ordinary income, when distributed.

This is my point. Raising capital gains taxes won't affect 401K's or IRA's. Neither will it affect pensions.

Sent from my phone. Instaurare omnia in Christo.
 
This is a spectacular claim that flies in the face of everything that I presented. I'm going to need you to back this up, taking into account home prices, health care costs, and debt.
First, I think we just need to agree that products, lifestyles, choices and political realities of 1960s were very different from today. It very hard to make apple to apples comparisons between the times pre-internet, pre-gobal competitiveness, pre-sharing economy. No matter what, you can admit there is more choice and better average services & produces today than 1960? The one good thing in comparing 1960 to 2017 is they share a prime rate of 4.5%.

I also think it's very important we are only talking opportunity and condition for millennials and younger, because I have very different thing to say about those older than that generation. I don't think millennials are going to very kind to them when their mistakes catch up.

Let start to establish baseline numbers for the troubling areas you highlighted:

1: Debt. Total 1960 private debt averaged by number of households and adjusted: $61,758 [$7,280]. In 2017, this number is $309,764. That is average household approximated across many situations has about 5x more in debt.

2: Housing. Based on the average new house in 1960 and the average house price in 2017, housing cost outpace inflation: 266%.

3: Medical expenses. This is perhaps the least relevant as this area in highly concentrated on 55+ populations and the two era could not be more different[near impossible to compare]. That said the average family healthcare cost in 2017 was $18,764 about 6x that spent in 1960. Government medical spending per person was up 7.88x.

4: Education. This average annual cost of higher education is $35,800 or 4x that of 1960.

See the trend yet these are all the areas of the market the government got involved? Was that as a cause or an effect - a testable hypothsis…

1: Debt Mortgages make up 40% of that. Consumer 32%. Student loans makes up 3%.

I would argue. The market especially due to the higher debt ratios of student loans makes millennials far more insulated from negative effects as growth slows and these debts eat income on those holding them.

2: Housing We agree housing is a relative asset based on having a family? Millennials and younger staying with parents, a reflection a delay in getting married and starting families as much as anything?

Since 1960, Family size is down 14%. Avg house size is 86% larger, on 40% larger lots. Comparing avg/sqft then reduces that 266% -> 96%. That too though is a little skewed as even more than size, land value matters. If one curves the prices low-high they find 40% of houses in 2017 higher than inflation and 60% the same or cheaper. In the areas where increases are as high as 385%, the $200,000+ income density higher than average. Remember a record 1/20 Americans today are millionaire or billionaires - don't they deserve nicer communities then 1960 standards? Accounting for the smaller needed by family size, the average new family is better off by buying power today by any objective measure. Add on the ability to make easy extra income via modern services like airBNB. Good time to be a young home buyer.

3: Medical There are lot of problems with the American medical system and affordability, many great ideas from around the world the help. These huge costs are hurting young families and proven to be preventing especially young men from starting businesses rather than working for employers who offer benefits. The bottom line though is Americans pay a lot for above average care. Government medical expensive will continue to raise as more people hit the heavy medical expense years. The closest country approximating care of the 1960s is Cuba. You find prices in Cuba (gov + private) are about that much lower in cost. If you would like to get your care in Cuba or similar you could be more than welcome to locally in my humble opinion. A story for another day. Deserves it's own thread.

4: education The difference in median income for a HS level household compare to one with bachelors or more is 122% annual. Associates: 42%. Based on the average years spend of 6 & 2. The costs pays for itself including deferred income conservatively are paid back in 9 and 6 years. Assuming completed by age 25 and retirement at 65: 1/2-2 Million dollars in created value.

In 1960, the same calc took 12 & 11 years to pay back. In 2017 dollars that $292,000-772,300 in created value.

In est, the calculable ROI is 74% higher, 50% more per year, 25% faster return. Add in more people are getting educated for a 400% cost and at increase it remains a steal of a deal. This also ignores the up-side potential. I'll get to that with income.
 
As you state, Boomers have the most accumulated wealth, yet you say they're struggling. When we look at discretionary income, which group is struggling the most? It's certainly not Boomers.
Yes, as expected(highest accumulation period) and not enough as it turns out. In an inflationary environment like ours holding is discouraged. So income not wealth is king. Invest your wealth wisely and you'll have both. Poorly and you have a nice short and a deadly long. This was the idea behind retirement and our current system. ~ invest when older, be like the old republican roman patron.

The fact so much of that wealth is housing and debt. Too high of intrest rates [housing prices come down, debt expenses up] and poof: crisis. That remains one of our biggest risk libilities.

Only the Boomers have significant discretionary income.
Sure, America has a debt problem and the government keeps stalling the economic engine and refusing to fix the problems or get out of the way. Trump even tried to get them to do the basics like curtail us back to balanced budget - nope. So it's higher taxes and lower descriary for tax paying working families as a result.

And a low income. I've shown you that median incomes are far below what they were in the 70s.
Incomes are realtive to skill and demand:

Comparative median/mean income by individual of 25-34 each year
adjusted to 2017 dollars
prime rate included as the higher that is the more costly generally debt purchased things are like housing, cars, education, medical emergencies

2017: $35,455 $45,503 [4.5%]
2010: $32,915 $39,635 [3.25%]
2000: $36,484 $44,406 [9%]
1990: $31,173 $36,064 [10%]
1980: $32,344.67 $34,722 [20%]
1970: $35,469.18 $38,060 [8%]
1960: $27,742.96 - [4.5%]

Not sure how one could argue 2017 isn't the best year. with early 2000s being next. 1980 being worst.

Comparative distribution : 1960

~Silent Generation: [Ages 25-34]
33% Low Income
38% Low Middle Class Income
26% Mid-High Middle Class Income
3% Upper Income[does not measure higher]

We're: 21% less in the bottom 50th. 4.6x more often already beyond middle.

Comparative distribution : 1975

~Early Baby Boomers[Ages 25-34]
32% Low Income
20% Low Middle Class Income
40% Mid-High Middle Class Income
8% Upper Income

About the same in the bottom 50th. 130% more of us to be beyond middle.

Look at how much of our economy is nothing but a wealth transfer, a net burden on society.
To be very clear I agree with you sentiment, I just think your method will not work as your objective and method is misplaced.
 
The US is a strong economy. However, the fact that we are so low when it comes to median tells us that most Americans aren't sharing in the benefits of the strong economy.

Sent from my phone. Instaurare omnia in Christo.

That's probably an accurate statement.

The US system is set up to let people enter the places they desire to be. It is up to them to enter. Or not.
 
Part 3: Nuance

Education and medical - bottom 50th
If medical spending is 6x more and education 4x doesn't that mean less people are able to afford those things?

Health cost risk
Due to the differences in options and realities, let's compare only a 'medical event' exceeding 25% of income.

Median Cost of Hospitalization 1960: $938 [$7,767]
Median Cost of Hospitalization 2017: $10,126
~30% more expensive than inflation.

1960: 28% households [35% of 25-35yr olds]

2017: 6%* households [30% of 25-35yr olds]

The 6% removes those who qualify for medicare / medicaid. Unadjusted it would be 38.9%.

Education
Let's compare at year of x4 cost plus deferred wages at median HS level:

Avg Cost of Education 1960: $811 [$6,715] + $6032 [$49,951] : $56,666
Avg Cost of Education 2017: $26,860 + $44,975 = $71,835

Cost: ~26% more expensive.

Bottom 50th in 1960 was <$5,620 [$46,539]
Bottom 50th in 2017 was <$61,372

Meaning the bottom 50th in 2017 still has about 32% more buying power. Which mean 7% more of the bottom could take the risk if they so choose.

Health spending [/b]
One has to see the problem with health is people refuse for moral reasons to let it diverge natrually into multiple affordability streams. Those at the top push higher quality[as they can afford it] but those innovations cost far too much for the bottom[who just need soild average quality care]. Most of the raises though are simply an aging population. Every generations block needs a factor more of care as they age, so the health risk and costs to 25-34 ~half that of 35-44 so on and so forth. This this system wide rise in spending which will peak in ~2030-2045, although with an aging longer that could change.

Efforts for affordability than raise costs for the younger in order to keep more poor older alive. This is considered a moral good? ACA flat-lining efforts have moved this curve more than ever. It's all a fools errand, but perhaps necessary. In a places like Canada, which take the opposite approach you see negative as a decline in quality in exchange for an increases in affordability. They do it by region though and if you compare the taxes raised to care provided [breaking even] the system is sustainable in 1/13 regions[proviences]. All the rest either defer costs, get subsidized or are declining in objective quality care standards.

I would like to highlight 'health care' is a sytem of dimishing returns. So the difference in quality and price is not direct. It costs far more to improve quality than it does to have cheap 'good enough' care. This is probabaly why america has the worse balance.
 
That's probably an accurate statement.

The US system is set up to let people enter the places they desire to be. It is up to them to enter. Or not.
The US is certainly not set up for you to enter higher ranks. It's set to keep you permanently down. That's the function of our personal debt levels.

Sent from my phone. Instaurare omnia in Christo.
 
This is my point. Raising capital gains taxes won't affect 401K's or IRA's. Neither will it affect pensions.

Sent from my phone. Instaurare omnia in Christo.

Raising capital gains taxes taxes should lower the value of stocks thus lowering the value of IRAs 401Ks and assets held by pensions. If you believe in fundamental analysis then you have to believe lowering after-tax returns will impact P/E ratios.
 
Raising capital gains taxes taxes should lower the value of stocks thus lowering the value of IRAs 401Ks and assets held by pensions. If you believe in fundamental analysis then you have to believe lowering after-tax returns will impact P/E ratios.

Yes, this is a fair criticism. Asset prices will certainly fall.

But if asset prices fall, then what happens to the real cost of living?
 
Yes, this is a fair criticism. Asset prices will certainly fall.

But if asset prices fall, then what happens to the real cost of living?

Nothing I can think of. The change would be how we value the company,not the products it produces.
 
First, I think we just need to agree that products, lifestyles, choices and political realities of 1960s were very different from today. It very hard to make apple to apples comparisons between the times pre-internet, pre-gobal competitiveness, pre-sharing economy. No matter what, you can admit there is more choice and better average services & produces today than 1960? The one good thing in comparing 1960 to 2017 is they share a prime rate of 4.5%.

Perhaps for toys and the like, like computers and televisions. It's not true of the necessities of life, especially housing.

1: Debt. Total 1960 private debt averaged by number of households and adjusted: $61,758 [$7,280]. In 2017, this number is $309,764. That is average household approximated across many situations has about 5x more in debt.

2: Housing. Based on the average new house in 1960 and the average house price in 2017, housing cost outpace inflation: 266%.

3: Medical expenses. This is perhaps the least relevant as this area in highly concentrated on 55+ populations and the two era could not be more different[near impossible to compare]. That said the average family healthcare cost in 2017 was $18,764 about 6x that spent in 1960. Government medical spending per person was up 7.88x.

4: Education. This average annual cost of higher education is $35,800 or 4x that of 1960.

See the trend yet these are all the areas of the market the government got involved? Was that as a cause or an effect - a testable hypothsis…

Perhaps that's true for medicine and education, but housing and debt?
I would argue. The market especially due to the higher debt ratios of student loans makes millennials far more insulated from negative effects as growth slows and these debts eat income on those holding them.

This doesn't make sense. How would higher debt levels insulate you?
 
2: Housing We agree housing is a relative asset based on having a family? Millennials and younger staying with parents, a reflection a delay in getting married and starting families as much as anything?

Disagree completely. This reflects the fact that it's more expensive to live. Look at any polls of millenials and why they aren't buying homes. The main reason is the expense, and it's not even close.

Since 1960, Family size is down 14%. Avg house size is 86% larger, on 40% larger lots. Comparing avg/sqft then reduces that 266% -> 96%. That too though is a little skewed as even more than size, land value matters. If one curves the prices low-high they find 40% of houses in 2017 higher than inflation and 60% the same or cheaper. In the areas where increases are as high as 385%, the $200,000+ income density higher than average. Remember a record 1/20 Americans today are millionaire or billionaires - don't they deserve nicer communities then 1960 standards? Accounting for the smaller needed by family size, the average new family is better off by buying power today by any objective measure. Add on the ability to make easy extra income via modern services like airBNB. Good time to be a young home buyer.

I VEHEMENTLY disagree here. Case-Shiller takes into account the factors that you mention. So let's look at median incomes vs. the Case-Shiller index.

fredgraph.png


https://fred.stlouisfed.org/graph/?g=mMKZ

Homes are becoming more and more unaffordable. They're about 50% higher than was average throughout the 1990s. Or, to put it another way:

ratio-tttma-median-new-home-sale-prices-and-median-household-income-annual-1967-to-2016-monthly-200012-to-201805.png


Which doesn't take into account those factors, but still shows how absolutely nuts things have become.

The point is, this idea that this is the best time ever to buy a home is completely detached from reality. We're in an era where homes are more out of reach than they've ever been, which is why home ownership among young people is at record lows.

3: Medical There are lot of problems with the American medical system and affordability, many great ideas from around the world the help. These huge costs are hurting young families and proven to be preventing especially young men from starting businesses rather than working for employers who offer benefits. The bottom line though is Americans pay a lot for above average care. Government medical expensive will continue to raise as more people hit the heavy medical expense years. The closest country approximating care of the 1960s is Cuba. You find prices in Cuba (gov + private) are about that much lower in cost. If you would like to get your care in Cuba or similar you could be more than welcome to locally in my humble opinion. A story for another day. Deserves it's own thread.

There are changes that can be made in medicine, but let me clear something up here. You're assuming that I'm a typical American leftist. I am no such thing. I am socially extremely conservative, and in favor of private property and low tax rates. I've just become massively anti-banking and anti-unearned income.

4: education The difference in median income for a HS level household compare to one with bachelors or more is 122% annual. Associates: 42%. Based on the average years spend of 6 & 2. The costs pays for itself including deferred income conservatively are paid back in 9 and 6 years. Assuming completed by age 25 and retirement at 65: 1/2-2 Million dollars in created value.

In 1960, the same calc took 12 & 11 years to pay back. In 2017 dollars that $292,000-772,300 in created value.

In est, the calculable ROI is 74% higher, 50% more per year, 25% faster return. Add in more people are getting educated for a 400% cost and at increase it remains a steal of a deal. This also ignores the up-side potential. I'll get to that with income.

Still disagree. Are you taking into account the interest on the debt?
 
Back
Top Bottom