If you would put aside your arrogance for just a moment you might learn something.
You're the one who is doing the learning here, it seems. My initial point was exceedingly simple - "cosmic radiation has remained more or less steady over the period of instrumental records" - and backed up by sound evidence, including from your own sources, in multiple subsequent posts. It has taken you no fewer than
six C&P attempts to post something which even
addresses that point, let alone teaching me the error of my ways :lol: Hopefully this change indicates that you have learned something from our conversation.
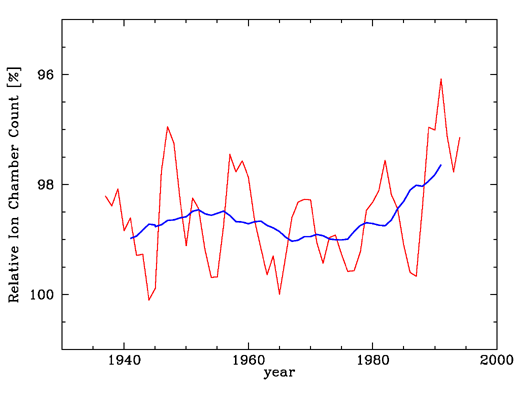
Fig. 6: The flux of cosmic rays reaching Earth, as measured by ion chambers. Red line - annual averages, Blue line - 11 yr moving average. Note that ion chambers are sensitive to particles at relatively high energy (several 10's of GeV, which is higher than the energies responsible for the atmospheric ionization [~10 GeV], and much higher than the energies responsible for the 10Be production [~1 GeV]). Plot redrawn using data from Ahluwalia (1997). Moreover, the decrease in high energy cosmic rays since the 1970's is less pronounced in low energy proxies of solar activity, implying that cosmogenic isotopes (such as 10Be) or direct solar activity proxies (e.g., sun spots, aa index, etc) are less accurate in quantifying the solar → cosmic ray → climate link and its contribution to 20thcentury global warming.
[/FONT]
There's two questions which are (or at least should be) blatantly obvious to you from this figure:
> Why (in a 2012/2013 post) is Shaviv using such old data which terminates in 1994?
> Why is he showing an 11 year mean?
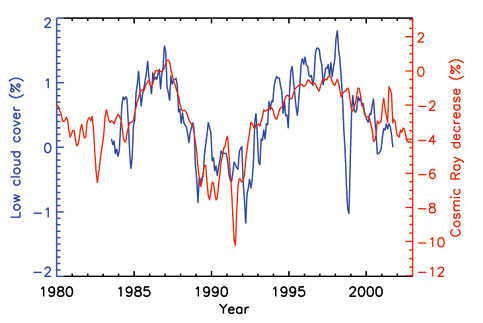
The theory is that cosmic radiation influences cloud formation rates. Cosmic radiation varies from year to year (or for that matter month to month and probably day to day), as does global cloud coverage. The relevant mechanism is that low-level clouds cool the local surface by blocking a portion of incoming sunlight. But when those clouds are gone, they are not still cooling the area, are they? If there's less than usual cloud cover in 1984, that might make 1984 a comparatively hot year, but it won't make 1986 or 1987 any hotter when they've got more clouds!
So why has Shaviv marked an average on the graph as if to imply that the GCR effect was to make 1986/87 hotter than 1969/70, when even from his own graph it's clear that the opposite is true? That later pair of years had the higher GCR value and thus
more cooling from extra cloud formation than 1969/70, if the theory is true.
On more or less the same note, it is indisputable that GCR values once again increased after the low values of the early 1990s. This is the image used in Marsh and Svensmark (2003), with data going up to the end of 2002 (taken from a different blog post of Shaviv's you linked earlier):
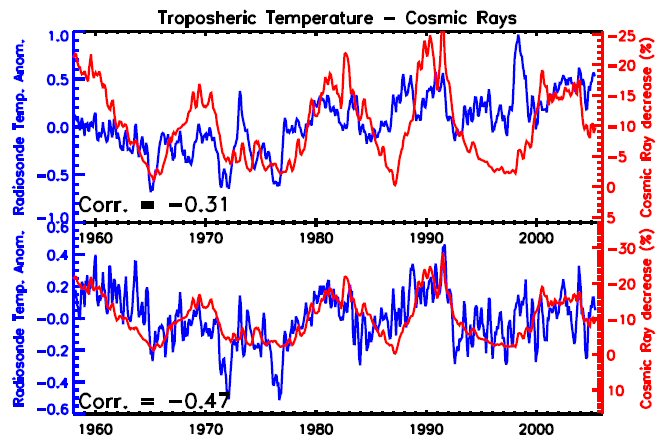
This is the image used in Svensmark and Friis-Christensen's reply to Lockwood and Fröhlich (2007), with data going up to 2006:
So why is it that in a 2012/13 blog post, Dr. Shaviv chose to use data from a 1997 paper with data going only up to 1994? Did he not want to show that the GCR values of the 2000s were the same as those of the 1980s - and actually a bit higher than 1958-61?
According to the theory, cosmic radiation was contributing more to warming (or more precisely, less to cooling) when solar activity peaked in 1959 than it was contributing in the early 2000s. This isn't some far-fetched outlandish notion, this is what is shown by the graphs from Svensmark's own papers and discussions. In fact in the caption to that second graph,
Svensmark and Friis-Christensen explicitly note that the GCR-temperature correlation only becomes particularly pronounced after removing the warming trend: "
The lower panel shows the match achieved by removing El Nin ̃o, the North Atlantic Oscillation, volcanic aerosols, and also a linear trend (0.14 ± 0.4 K/Decade)."
After six attempts in this thread - and it's a point I've raised in previous threads also - you have finally come up with a relevant reply, but pending coherent answers to these two questions, there's an obvious discrepancy here which is far more likely the result of misleading material in a blog post than in Svensmark's academic publications.