
- Joined
- Jan 28, 2013
- Messages
- 94,823
- Reaction score
- 28,342
- Location
- Williamsburg, Virginia
- Gender
- Male
- Political Leaning
- Independent
Yikes! Here we have a German scientist deceptively manipulating temperature charts to attack a Jewish scientist. I guess each of us honors the past in his/her own way.
PIK Scientist Rahmstorf Goes After Hebrew University’s Nir Shaviv …But Gets Caught Fudging Inconvenient Data
By P Gosselin on 18. January 2019
Stefan Rahmstorf caught redhanded manipulating temperature charts
By Michael Krueger
(Text translated/edited by P. Gosselin)
Three days ago, climate researcher Stefan Rahmstorf published an article at his KlimaLounge blog on the hearing of Jewish climate scientist Nir Shaviv in the German Bundestag concerning the Climate Change Conference in Katowice.
Accuses Shaviv of presenting “outlandish theories”
There he describes Shaviv as a “climate skeptic” with outlandish theories and who is courted by the fossil lobby and AfD Party. During the hearing, the German Left party even accused Shaviv of obviously being paid to publish climate-denialism. Stefan Rahmstorf went even further, claiming, “This is a targeted misleading of the layperson audience”.
Just who is misleading whom, I would like to pursue here.
The conflict between Jewish climate scientist Nir Shaviv and Stefan Rahmstorf dates back to 2003, when Stefan Rahmstorf wrote the following e-mail to his colleagues:
Dissenters get labelled as right wingers
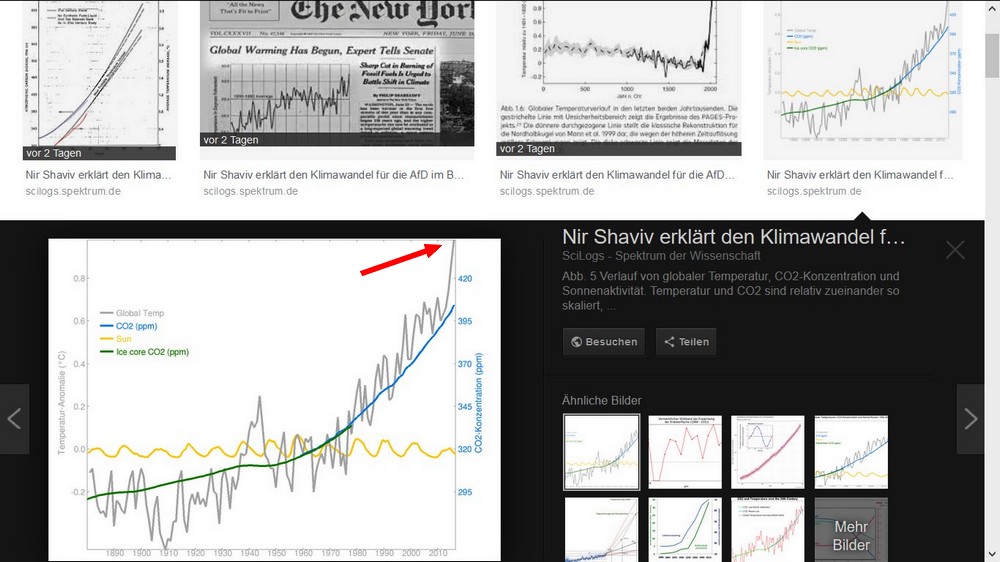
In the comment area of Mr. Rahmstorf’s article, some commentators — who were immediately labelled by other commenters as right wing spectrum — criticized that NASA’s temperature curve in Figure 5 was truncated in 2016, exactly when the last El-Nino pushed up the global temperature. Mr. Rahmstorf vehemently rejected the criticism.
In the article Mr. Rahmstorf refers to a link on how to create your own widget according to Figure 5, here the link. There the year 2017 is included and the curve is not cut off at 2016. Between 2016 and 2017 the global temperature dropped by 0.1°C, and in 2018 by a further 0.1°C.
Hide the decline
In the year 2016 we were at +1°C temperature anomaly according to NASA (a new record!), but today in the year 2018 only at 0.8°C. Mr. Rahmstorf obviously wanted to hide this by cleverly truncating at 2016, probably with the hope his lay public would not notice it? . . .
PIK Scientist Rahmstorf Goes After Hebrew University’s Nir Shaviv …But Gets Caught Fudging Inconvenient Data
By P Gosselin on 18. January 2019
Stefan Rahmstorf caught redhanded manipulating temperature charts
By Michael Krueger
(Text translated/edited by P. Gosselin)

Three days ago, climate researcher Stefan Rahmstorf published an article at his KlimaLounge blog on the hearing of Jewish climate scientist Nir Shaviv in the German Bundestag concerning the Climate Change Conference in Katowice.
Accuses Shaviv of presenting “outlandish theories”
There he describes Shaviv as a “climate skeptic” with outlandish theories and who is courted by the fossil lobby and AfD Party. During the hearing, the German Left party even accused Shaviv of obviously being paid to publish climate-denialism. Stefan Rahmstorf went even further, claiming, “This is a targeted misleading of the layperson audience”.
Just who is misleading whom, I would like to pursue here.
The conflict between Jewish climate scientist Nir Shaviv and Stefan Rahmstorf dates back to 2003, when Stefan Rahmstorf wrote the following e-mail to his colleagues:
I feel another recent paper may require a similar scientific response, the one by Shaviv & Veizer (attached). …This paper got big media coverage here in Germany and I guess it is set to become a climate skeptics classic: …”
Since then, Shaviv has fallen out of favor with Stefan Rahmstorf.
Dissenters get labelled as right wingers
In the comment area of Mr. Rahmstorf’s article, some commentators — who were immediately labelled by other commenters as right wing spectrum — criticized that NASA’s temperature curve in Figure 5 was truncated in 2016, exactly when the last El-Nino pushed up the global temperature. Mr. Rahmstorf vehemently rejected the criticism.
In the article Mr. Rahmstorf refers to a link on how to create your own widget according to Figure 5, here the link. There the year 2017 is included and the curve is not cut off at 2016. Between 2016 and 2017 the global temperature dropped by 0.1°C, and in 2018 by a further 0.1°C.
Hide the decline
In the year 2016 we were at +1°C temperature anomaly according to NASA (a new record!), but today in the year 2018 only at 0.8°C. Mr. Rahmstorf obviously wanted to hide this by cleverly truncating at 2016, probably with the hope his lay public would not notice it? . . .
