• This is a political forum that is non-biased/non-partisan and treats every person's position on topics equally. This debate forum is not aligned to any political party. In today's politics, many ideas are split between and even within all the political parties. Often we find ourselves agreeing on one platform but some topics break our mold. We are here to discuss them in a civil political debate. If this is your first visit to our political forums, be sure to check out the RULES. Registering for debate politics is necessary before posting. Register today to participate - it's free!

Red States / Blue States

If your dollar is worth 50% less in say California vs W. Virginia and you don't understand that then sorry but some people just are too economically challenged to deal with.

But income is 50+% more in CA. The net is higher in CA. Which would you rather have? You're losing money for the honor of living in a red state.
 
You're another case of con ignorance. Most states at the top of the disposable income list are blue. Most at the bottom are red:


Another Conservative disposable claim.
They are at the top because of the high cost of living in those blue states. You don't seem to grasp that reality. The more you pay in taxes and higher prices for goods and services the less spendable income you have. As proven it costs a lot more to live in LA than W. Virginia or Mississippi yet the poverty dollar amount is the same for all states. People at the poverty level in low cost of living red states have more spendable income. I find it amazing how people are fleeing liberal utopia for Red states since Blue states offer so much according to you
 
But income is 50+% more in CA. The net is higher in CA. Which would you rather have? You're losing money for the honor of living in a red state.
Tell that to the people moving to TX from California, why are they doing that? You really don't get cost of living, do you
 
They are at the top because of the high cost of living in those blue states. You don't seem to grasp that reality. The more you pay in taxes and higher prices for goods and services the less spendable income you have. As proven it costs a lot more to live in LA than W. Virginia or Mississippi yet the poverty dollar amount is the same for all states. People at the poverty level in low cost of living red states have more spendable income. I find it amazing how people are fleeing liberal utopia for Red states since Blue states offer so much according to you

Disposable (spendable) income accounts for taxes and prices of goods and services. It's the money left over after paying for all that, and more. I'd rather have 10% more in a blue state to pay for a 5% higher COL vs having 10% less in a red state to pay a 5% lower COL. That's the math you fail to comprehend.

The states with the highest poverty rates are mostly red states.
Yes and yet it is spendable income that matters, the higher the taxes the less spendable income people have for goods and services. You still don't get it, the poverty level is a fixed amount FOR THE NATION ignoring state cost of living so as I posted the very poor state of Mississippi with a person at or below the poverty level has more spendable income than someone living in California.. For some reason you cannot grasp that reality as all poverty isn't equal.
 
Tell that to the people moving to TX from California, why are they doing that? You really don't get cost of living, do you

You really don't get the math, do you?

Try looking at the evidence:


Pop growth in CA is higher than in many red states both currently and 2010 - 2022.

You have a problem with facts.
 
You really don't get the math, do you?

Try looking at the evidence:


Pop growth in CA is higher than in many red states both currently and 2010 - 2022.

You have a problem with facts.
The evidence that matters is the cost of living, also personal responsibility exists in this country which apparently doesn't exist with you. it is cheaper to live in say Mississippi or most Red states than it is Blue states that is a fact thus poverty activity is also different. People are fleeing California being replaced by welfare whores, that too is reality. Why don't you find out why people are leaving liberal utopias for Red States? Quality of life plays a role as does the freedom from Gov't interference. You deem Blue state values more than the people leaving the state

 
Right because we know that higher taxes in Blue states have no impact on spendable income, right? Keep buying that liberal BS ignoring withholding and the taxes you pay in those Blue states reducing your spendable income

I've already given you the proof that those states with the most disposable, what you call "spendable", income are blue states. See you on another thread.
 
I've already given you the proof that those states with the most disposable, what you call "spendable", income are blue states. See you on another thread.
Disposable income is affected by taxes and regulations, where did you get your education? You need more income to live in Blue states than Red states and as pointed out, fact remains the poverty level and dollar amount is universal but cost of living isn't
 
Yes, which is why I also calculated the per capita household median income, also adjusted by cost of living plus number of average residents. The top ten include three Red states (#1 North Dakota, #4 Wyoming, #8 Nebraska) and two Purple states that are well on their way to becoming Red states (#2 Iowa & #10 Ohio), plus another solidly Purple state (#9 Wisconsin). The four Blue states are #3 Minnesota, #5 New Hampshire, #6 Illinois, #7 New Jersey. The Big names for Red States/Blue States are well down the list, Texas at #36 and California at #49.


Don't forget that this ranking is based on votes for multiple offices, including governor, over a sixteen year period. Over those sixteen years, West Virginia voted Republican 75% of the time for the House, 29% of the time for the Senate, 25% of the time for Governor, and 100% of the time for President. As Democrats that are personally popular retire or are finally defeated, West Virginia will shift into the Red column. At this point, it looks like it's just a matter of time.

GDP skews any figure used to represent economic well-being as if it applies to everyone. A rising GDP does not necessarily apply to all income levels and economic groups. Any such figure is not a valid representation as described.

I never found if you provided the source data on which your rankings are based, being "per capita household median income", also adjusted by "cost of living" plus "number of average residents". So, I can't check your figures. Any links, please?
 
I never found if you provided the source data on which your rankings are based, being "per capita household median income", also adjusted by "cost of living" plus "number of average residents". So, I can't check your figures. Any links, please?
I had to come up with that number myself, because while the median household income stat is a standard, dividing it by the average number of people per household isn't nor is adjusting it by cost of living. Unfortunately the character limit prevents me from posting the entire chart, but here's the numbers for the top ten. Note that you divide by the CoL Index, not multiply:

RankState2021 Median HouseholdIndividuals per Household2021 CoL Indexpc Median HI/CoL
1North Dakota
$90,100​
2.28​
0.9791
$40,361.09​
2Iowa
$79,500​
2.38​
0.9162
$36,458.59​
3Minnesota
$93,100​
2.48​
1.0308
$36,418.63​
4Wyoming
$81,900​
2.42​
0.9311
$36,347.30​
5New Hampshire
$98,200​
2.44​
1.1125
$36,176.09​
6Illinois
$85,000​
2.54​
0.9378
$35,684.12​
7New Jersey
$106,000​
2.65​
1.1403
$35,078.49​
8Nebraska
$79,400​
2.44​
0.9308
$34,960.23​
9Wisconsin
$80,300​
2.38​
0.9751
$34,601.06​
10Ohio
$75,300​
2.40​
0.9102
$34,470.45​
 
How is unemployment looking?
The top ten are:
  • Minnesota 17.2% 1.8
  • Nebraska 92.3% 2
  • New Hampshire 19.1% 2
  • Utah 95.7% 2
  • Vermont 15.6% 2.1
  • North Dakota 83.8% 2.3
  • South Dakota 88.8% 2.3
  • Kansas 83.6% 2.4
  • Iowa 64.1% 2.5
  • Missouri 69.7% 2.5
So that's three Blue states, six Red states, and one Purple state on its way to becoming a Red state. The ten worst are:
  • Alaska 95.0% 4.5
  • New Mexico 19.8% 4.5
  • Delaware 6.3% 4.4
  • Illinois 24.6% 4.4
  • Nevada 40.0% 4.4
  • New York 6.2% 4.4
  • Pennsylvania 36.8% 4.3
  • Michigan 33.1% 4.2
  • Hawaii 6.3% 4.1
  • Texas 91.5% 4
So that's six Blue states, two Red states, and two Purple states. But the truth is that no state is doing all that poorly insofar as unemployment is concerned--4.5 isn't that bad, and 1.8 might actually be too low.
 
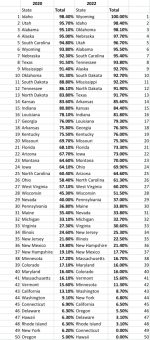
So the 2022 elections are over, with one House race still uncalled—but it’s in California, and if the Democrat wins it just drops California’s score by 1/10th of a percent, so why wait? Here’s the new rankings, along with 2020’s for comparison.

1669332603921.png
 
So the 2022 elections are over, with one House race still uncalled—but it’s in California, and if the Democrat wins it just drops California’s score by 1/10th of a percent, so why wait? Here’s the new rankings, along with 2020’s for comparison.

View attachment 67424500
What are you ranking?
 
What are you ranking?
Right now I’m using the votes for governor, the House, Senate, and president, over the past eight election cycles, each of the four counting for 25% of the total.

I just found out that Ballotpedia keeps track of all the election results for state legislatures as well and so will be eventually be including those numbers (except for Nebraska) with each counting for 16.67%. But that’s going to take awhile, that is a lot of elections to run through.
 
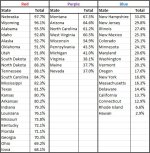
So it's taken me almost ten months to get my spreadsheet updated to include the state legislatures, but finally here are the final numbers. (Note that Nebraska's are unchanged--that state has a unicameral legislature with no official party registrations.) You can compare it to three posts ago to see how that changes things, but briefly there are 23 Red states, 10 Purple states, and 17 Blue states, an expansion of the middle from 24 Red states, 7 Purple states, and 19 Blue states:

peU8mBi.jpg
 
First things first. I like statistics as much as the next guy, but often they reveal more about what is not included. For instance, there is no qualitative component to the data. It assumes Americans line up to vote Red or Blue and that nothing else matters. It does. In their safe havens, neither party cares who is running on their side, because the people, in fact, do vote by color. In contested races candidate quality counts. Take the 2022 midterm elections. In contested races there was a qualitative difference between who won and who lost.

In my opinion the only valid data is for elections where extreme gerrymandering is not the determative issue. So, only Governor and Presidential races are valid illustrations of voter choice. In vast areas of America the republicans or the democrats choose their voters by the often extremely gerrymandered "voting districts" which they create. A dead republican dog can get elected in a properly gerrymandered republican district. Same for democrats. I don't believe any voting data based on these artificial and cynical voting districts represent anything more than voter disenfranchisement and thus is worthless as comparative data.

I like the detail, but I wonder how relevant it is in today's political environment. I live in Texas that is a very RED state but Trump won by only a little over 5%. I think the challenge I have in looking at historical voting data is how "traditional" our current parties are. Democrats seem pretty traditional. The far left continues to be frustrated by more middle of the road Democrats. They continue to believe that the US government can and should be a force for the good of the American people.

The pre-Trump Republican party kept it ultra right wing under control. They believed in limiting the government to providing only those things that people could not provide for themselves. They demanded a balanced budget, supported law enforcement at local, regional and national levels. They believed fervently in the rule of law and that America should be a world leader in human rights and supported alliances with those who held common cause with democracy over all forms of autocracy.

Today, the pre-Trump Republican party has evaporated. Today's Republican party is split between those looking for niche opportunities to support traditional republican values and those who live only to re-elect Trump. Let's call them what they are, MAGANS. The MAGA leader must be immune from the law, because law enforcement at all levels is now the enemy of the people as is all media not expressly devoted to the Leader. Trump left us $7 Trillion in debt in 4 years, so MAGANS, rage about the "budget" it is obviously only because it is not a multi-trillion dollar loss of their choosing.

The sad reality is that the Democrats have an aged incumbent with no future upside. The Republicans have an aged candidate who is morally compromised with extensive criminal trials to face and who has disparaged the Constitution, NATO, rule of law and sworn to dismantle that justice system in America to be replace with loyalist zombies who have no RINO stink on them. Trump is the only candidate in American history who will give America the clear choice between out Democracy and a bight new future as an Autocracy.

No matter how voters have voted in the past, the next Presidential election will determine if a nation, conceived in liberty, and dedicated to the proposition that all men are created equal can long survive.
 
And here's where things stand after the 2023 elections:

RSBS 2023.jpg

So no change in the numbers: 23 Red states, 10 Purple states, and 17 Blue states. But that's going to change after 2024, I think. Montana, at least, is a Purple state by 2/10ths of a percent and Tester is in trouble....
 
Back
Top Bottom