• This is a political forum that is non-biased/non-partisan and treats every person's position on topics equally. This debate forum is not aligned to any political party. In today's politics, many ideas are split between and even within all the political parties. Often we find ourselves agreeing on one platform but some topics break our mold. We are here to discuss them in a civil political debate. If this is your first visit to our political forums, be sure to check out the RULES. Registering for debate politics is necessary before posting. Register today to participate - it's free!

Idiotic Environmental Predictions

Tony demonstrate that prior temperature record grafts are different from the modified versions now. The prior grafts shows a cooling trend from 1921 to 1979, but the modified versions show the opposite. The agencies have very little historic data outside of U.S., Easter Europe and parts of Australia, and don’t know the land and ocean temperatures from the past. This is the biggest scam in Science History and they know it.
Actually, the 35-year cooling period was from 1945 until 1980. Prior to that, from 1915 until 1945 was a 30-year warming period (similar to the 30-year warming period that occurred between 1980 and 2010).

It was during the 30-year warming period of 1915 and 1945 that the vast majority of States experienced record high temperatures. More States set new record high temperatures during the 1930s (1936 in particular) than at any time before or since. The 1930s remain the hottest decade on record for the US in more than 150 years of record keeping.

Another 35-year cooling period began in 2010, so we are not likely to see another 30-year warming period until at least 2045.
 
The MSM in collusion with the government is creating a fake story to vilify fossil fuels. They say that July 4th was the planet hottest day on record. Temperature data of many world places are make up by government agencies. In 1978, meteorologists conclude that “there is no end in sight to the cooling on the last 30 years.”
As I am learning more and more about how the climate science agenda is shaping up, and more facts regarding the science...

What is they were right and the climate was cooling? We had an uptick in temperature when we cleared up the skies, and have no real temperature data that can be trusted. the ever growing urban heat island effect skewing monitoring stations makes it impossible to assess actual global changes, and the corrections appear to be made based on what the assumed earth energy balance is, with 100% disregard to important variables like the endothermic cooling of photosynthesis.
 
Another 35-year cooling period began in 2010, so we are not likely to see another 30-year warming period until at least 2045.
This is a possibility that should not be denied by the AGW cult, but they deny any science that does not fit nicely in their religeous like belief.
 
As I am learning more and more about how the climate science agenda is shaping up, and more facts regarding the science...

What is they were right and the climate was cooling? We had an uptick in temperature when we cleared up the skies, and have no real temperature data that can be trusted. the ever growing urban heat island effect skewing monitoring stations makes it impossible to assess actual global changes, and the corrections appear to be made based on what the assumed earth energy balance is, with 100% disregard to important variables like the endothermic cooling of photosynthesis.
IMG_0661.gif
 
This is a possibility that should not be denied by the AGW cult, but they deny any science that does not fit nicely in their religeous like belief.
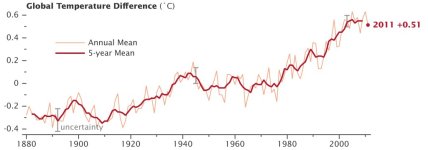
It is based on NASA GISS data. Between 1880 and 2010 we had two 35-year cooling periods where surface temperatures decreased by an overall temperature of 0.38°C, and two 30-year warming period where surface temperatures increased by an overall temperature of 0.89°C, resulting in a net increase of 0.51°C over the 130 year period.

NASA GISS.jpg

I have also read other sources that claimed the 30-year period between 1850 and 1880 was also a warming period, but they only have proxy data to support this assertion. Not like the actual observations NASA used. If true, however, that would make three 30-year warm periods and two 35-year cold periods.

Using only NASA's GISS data, that gives us two confirmed 35-year cooling periods, and two 30-year warming periods. It is not much of a trend, but it would seem more likely than not that the same climatic conditions we experienced in the past would continue into the future.
 
Tony Heller
Posted on July 10, 2023

NASA is attempting to scam the public about climate with a red hot map that has nothing to do with what they want people to believe it is.
There are few location on the planet with daily temperature data, except from the US and some from Western Europe. It is clear that the red hot NASA map is a fake. The map does not reflect surface temperatures, it is satellite imagery colored red. NASA started the measurements in 1979 the coldest year on record. The hottest day in the US occurred on July 4th, 1911, with most of the country over 100 degrees. That is the reason NASA started in 1979, to avoid the record heat wave. It has lost a lot of credibiity.
 
Tony Heller
Posted on July 11, 2023

“Who controls the food supply controls the people; who controls the energy can control whole continents; who controls money can control the world.” — Henry Kissinger
In this video Tony Heller discuss how the US government and the media work together to mislead the people about climate. The year 1983 was the lower burn acreage of the century, that is why the graph was started day year because its show a high increase in burn acreage. In 1945, the US Forest Service says that an average of 31 million acres of forest land is burn every year, an area larger than the State of New York, during the first half of the 20th century. According to a 1995 report from the US government burn acreage is down a 90% since 1930. The graph show that is no is no correlation between burn acreage and CO2. They just want to blame fossil fuels.
 
The assumption is silly from the start, lots of leafy green plants, vastly increase the surface area of a given acre of land.
More surface area, means more surface tension to hold water.
The plants are constantly transpiring, and drawing water from the ground, leaving space for the rainwater to
re saturate the soil. Anyone who has had one of those old majestic oak trees in their yard, knows
they transpire several hundred gallons of water a day, and the soil shrinks around them.
Plants use water to cool their leaves so they do not burn up in the hot sun. High relative humidities reduce transpiration greatly, we understand that well in S. Florida. As the Earth gets wetter from AGW there will be higher relative humidities and therefore less transpiration.
 
In this video Tony Heller discuss how the US government and the media work together to mislead the people about climate. The year 1983 was the lower burn acreage of the century, that is why the graph was started day year because its show a high increase in burn acreage. In 1945, the US Forest Service says that an average of 31 million acres of forest land is burn every year, an area larger than the State of New York, during the first half of the 20th century. According to a 1995 report from the US government burn acreage is down a 90% since 1930. The graph show that is no is no correlation between burn acreage and CO2. They just want to blame fossil fuels.

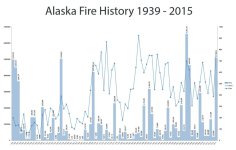
Alaska did not start recording wildfires until 1939. That was the year the Alaska Fire Control Service was created.

During the last cool period from 1945 until 1980 was the lowest number of wildfires and as a result, the least amount of land destroyed by wildfires. While during the last warm period from 1980 until 2010 held the largest and most numerous destructive wildfires. However, since the current cool period began in 2010 the number and size of wildfires have once again declined. Wildfires in Alaska have continued to decline in both number and size since 2015.

Alaska Fire History.jpg

NOTE: The 6.6 million acres that burned during the 2004 wildfires in Alaska were fueled by millions of acres of beetle-killed spruce. The spruce beetle destroyed 2.3 million acres (9,300 km²) of spruce forests in Alaska from 1992 to 1999.
 
Plants use water to cool their leaves so they do not burn up in the hot sun. High relative humidities reduce transpiration greatly, we understand that well in S. Florida. As the Earth gets wetter from AGW there will be higher relative humidities and therefore less transpiration.
If a plant cool itself via transpiration, and high humidity makes transpiration less efficient, it needs more water
to achieve the same level of cooling. This happens with us Humans as well.
 
Tony Heller

Posted on July 15, 2023

Fake historical statistics and bright red maps are key tools being used to scare people into compliance with an anti-energy agenda.
According to Heller, “hell has always been represented as varying shade of red and that identical color scheme is now being use to scare people about the burning of fossil fuels.” From the map looks that Europe is on fire. It is claimant that North Atlantic ocean surface temperatures are hotter than it has ever been. That is not true. The US weather bureau says that during the winter 1921-1922 the ocean did not freeze over. During the summer of 1922, Artic Norway had temperatures up to 95 degrees Fahrenheit and have nothing to do with fossil fuels.
 
According to Heller, “hell has always been represented as varying shade of red and that identical color scheme is now being use to scare people about the burning of fossil fuels.” From the map looks that Europe is on fire. It is claimant that North Atlantic ocean surface temperatures are hotter than it has ever been. That is not true. The US weather bureau says that during the winter 1921-1922 the ocean did not freeze over. During the summer of 1922, Artic Norway had temperatures up to 95 degrees Fahrenheit and have nothing to do with fossil fuels.
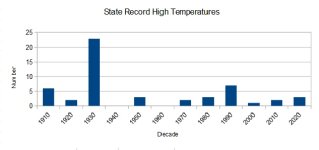
That is consistent with NASA's GISS data. It shows a 35-year cooling period from 1880 until 1915, followed by a 30-year warm period from 1915 until 1945. During that warm period a lot of States established new record high temperatures that have yet to be broken. It reached 100°F (37.8°C) on July 27, 1915 at Fort Yukon, Alaska. Which is still the State's highest recorded temperature to this day. During the Summer of 1936 the lower-48 was hit by a massive heat wave that broke State records all across the mid-west. More record high temperatures were set during the 1930s than during any decade since the 1880s.

Record High Temperatures.jpg

Source:
 
That is consistent with NASA's GISS data. It shows a 35-year cooling period from 1880 until 1915, followed by a 30-year warm period from 1915 until 1945. During that warm period a lot of States established new record high temperatures that have yet to be broken. It reached 100°F (37.8°C) on July 27, 1915 at Fort Yukon, Alaska. Which is still the State's highest recorded temperature to this day. During the Summer of 1936 the lower-48 was hit by a massive heat wave that broke State records all across the mid-west. More record high temperatures were set during the 1930s than during any decade since the 1880s.

View attachment 67496099

Source:
One hundred years ego very high temperatures were recorded in the Artic. According to the US records the hottest temperatures ever recorder in Alaska was 100 degrees. In 1957 temperatures reached a 100 degrees north of the Arctic Circle. These weather professors' conclusions are based in misinformation about historical temperatures.
 
One hundred years ego very high temperatures were recorded in the Artic. According to the US records the hottest temperatures ever recorder in Alaska was 100 degrees. In 1957 temperatures reached a 100 degrees north of the Arctic Circle. These weather professors' conclusions are based in misinformation about historical temperatures.
Alaska did indeed experience a record high temperature of 100°F at Fort Yukon in 1915, which was the very beginning of the 30-year warm period. By 1945 another 35-year cold period began. I could not find any temperature record that demonstrates surface temperatures reached 100°F in the Arctic in 1957. Can you provide a source for this claim?

You should also be aware that there are no temperature records above 48°N prior to 1910. Furthermore, the temperature records NASA GISS was able to obtain between 1880 and 1930 was very spotty, at best. There are gaps in the temperature record extending for months. Which is why NASA GISS data has such a high uncertainty prior to 1930. As our record keeping got better that uncertainty level began to decline.

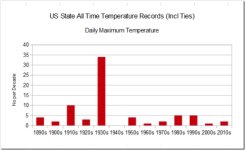
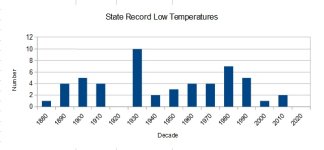
I have also updated the US State All Time Temperature Record, and excluded ties. Keeping only the most recent record established. I also included both the US Virgin Islands and Puerto Rico, which makes for a total of 52 established records. I also did the same thing for the lowest recorded temperatures:

State Record High Temperatures.jpg

State Record Low Temperatures.jpg

The 1930s remains both the hottest and coldest decade on record among all 50 States, the US Virgin Islands, and Puerto Rico.
 
Last edited:
Alaska did indeed experience a record high temperature of 100°F at Fort Yukon in 1915, which was the very beginning of the 30-year warm period. By 1945 another 35-year cold period began. I could not find any temperature record that demonstrates surface temperatures reached 100°F in the Arctic in 1957. Can you provide a source for this claim?

You should also be aware that there are no temperature records above 48°N prior to 1910. Furthermore, the temperature records NASA GISS was able to obtain between 1880 and 1930 was very spotty, at best. There are gaps in the temperature record extending for months. Which is why NASA GISS data has such a high uncertainty prior to 1930. As our record keeping got better that uncertainty level began to decline.

I have also updated the US State All Time Temperature Record, and excluded ties. Keeping only the most recent record established. I also included both the US Virgin Islands and Puerto Rico, which makes for a total of 52 established records. I also did the same thing for the lowest recorded temperatures:

View attachment 67499148

View attachment 67499149

The 1930s remains both the hottest and coldest decade on record among all 50 States, the US Virgin Islands, and Puerto Rico.
Climate Fakery Part 12 (youtube.com)

Tony Heller

Posted on July 20, 2023

Summer brings hot weather to many locations. In this video I discuss how the press uses meaningless statistics and bright red maps to try to scare the audience into giving up their reliable supply of energy.
According to the press there's an historic Heat Wave broiling the United States and the world in a climate meltdown course by the burning of fossil fuels. Since the 1930s burn acreage in the United States is down 80 percent with 2023 so far being at a record low. The hottest summer in the US occurred in 1936. A great part of the US reached 110 degree Fahrenheit during the summer of that year.
 
According to the press there's an historic Heat Wave broiling the United States and the world in a climate meltdown course by the burning of fossil fuels. Since the 1930s burn acreage in the United States is down 80 percent with 2023 so far being at a record low. The hottest summer in the US occurred in 1936. A great part of the US reached 110 degree Fahrenheit during the summer of that year.
If there was an historic heat wave broiling in the US don't you think that there would be some sort of temperature records being broken somewhere? Obviously, surface temperatures are not nearly as warm as they were during the 1930s, or we would be seeing temperature records being broken, and we don't. The decade of the 1930s still holds more record high temperatures than any decade before or since.

So everything they are spewing about how each subsequent year is warmer than the previous year is a flat-out deliberate lie, and not even a very good lie since temperature records instantly disproves their bogus claims.
 
According to the press there's an historic Heat Wave broiling the United States and the world in a climate meltdown course by the burning of fossil fuels. Since the 1930s burn acreage in the United States is down 80 percent with 2023 so far being at a record low. The hottest summer in the US occurred in 1936. A great part of the US reached 110 degree Fahrenheit during the summer of that year.
Damn… this is just stupid. The historic heat wave is global but this quote is just about the US. Typical denialist cherry-picking BS. Tony Heller is a dishonest hack.
 
If there was an historic heat wave broiling in the US don't you think that there would be some sort of temperature records being broken somewhere? Obviously, surface temperatures are not nearly as warm as they were during the 1930s, or we would be seeing temperature records being broken, and we don't. The decade of the 1930s still holds more record high temperatures than any decade before or since.

So everything they are spewing about how each subsequent year is warmer than the previous year is a flat-out deliberate lie, and not even a very good lie since temperature records instantly disproves their bogus claims.
And this is even more denialist stupidity. Just because the US hasn’t broken any all-time records recently doesn’t prove anything other than the fact that Glitch doesn’t have a clue how overall temperatures are calculated and recorded.
 
Damn… this is just stupid. The historic heat wave is global but this quote is just about the US. Typical denialist cherry-picking BS. Tony Heller is a dishonest hack.
I would lay odds the global data would be similar.
And this is even more denialist stupidity. Just because the US hasn’t broken any all-time records recently doesn’t prove anything other than the fact that Glitch doesn’t have a clue how overall temperatures are calculated and recorded.
Yes, we know. Change the metric to make the data work for you.

Facts make statistics, and statistics can be made to lie.
 
[quiote](400) Climate Fakery Part 13 - YouTube

Tony Heller

Posted on July 23, 2023

US heatwaves are much less severe now than they were prior to 60 years ago, so climate propagandists have replaced science and history with bright red maps. [/quote]
Maps, like the one on the video, have been used on TV and the internet to convince people that Heat Wave are burning up, and they need to get rid of fuels to avoid getting hotter. In the U.S, on August 2nd 1931 all the states were over 90 degrees Fahrenheit, 33 over 100 and 10 over 110. The U.S. temperature record on the las 100 years show a decline in hot weather as CO2 levels has increased.
 
Excellent article by Walter E. Williams summarizing the fail environmental predictions. The actual environmental movement led by the ‘Progressives/Regressive’ with the disguise to save humankind, is a tool to advance the socialist agenda. This movement can be compare to a watermelon, ‘green on the outside and red inside.” Green is the new red.


Hind sight is always 20-20.

To live it, though, is to live in the past.

Let's have a thread on the number of times Christians have predicted the return of the Messiah?
 
Tony Heller

Posted on July 23, 2023

US heatwaves are much less severe now than they were prior to 60 years ago, so climate propagandists have replaced science and history with bright red maps.
Maps, like the one on the video, have been used on TV and the internet to convince people that Heat Wave are burning up, and they need to get rid of fuels to avoid getting hotter. In the U.S, on August 2nd 1931 all the states were over 90 degrees Fahrenheit, 33 over 100 and 10 over 110. The U.S. temperature record on the las 100 years show a decline in hot weather as CO2 levels has increased.

That is because there is a 65-year cycle before we get back to a warming period again. There is a 30-year warming cycle, when heat waves are at their worst, followed by a 35-year cooling cycle, when surface temperatures either drop or rise very slowly. 60 years ago would have been 1964, which was pretty much the middle of the last cooling period. Give it until sometime after 2045 before you see another serious heat wave in the US.
  • 1850-1880 = Warming
  • 1880-1915 = Cooling
  • 1915-1945 = Warming
  • 1945-1980 = Cooling
  • 1980-2010 = Warming
  • 2010-2045 = Cooling
  • 2045-2075 = Warming
This is what these indoctrinated idiots do not understand.

There are several natural cycles that our ecosystem has.
 
Back
Top Bottom