• This is a political forum that is non-biased/non-partisan and treats every person's position on topics equally. This debate forum is not aligned to any political party. In today's politics, many ideas are split between and even within all the political parties. Often we find ourselves agreeing on one platform but some topics break our mold. We are here to discuss them in a civil political debate. If this is your first visit to our political forums, be sure to check out the RULES. Registering for debate politics is necessary before posting. Register today to participate - it's free!
Daily Statistical Summary of COVID-19

***********************************************

BLOCK 6 – THE “TOP 25”s

***********************************************

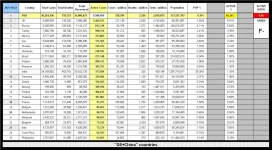
Of the 25 countries with the highest number of TOTAL cases, the US, with around 9.10% of the total population of the group, has around 18.57% of the total cases for the group. This is roughly 1.98 times its proportional share and earns a “D“.

21-10-23 F1A - Worldometer TOP TOTAL Cases TABLE.JPG
Of the 25 countries with the highest number of currently ACTIVE cases, the US, with around 9.39% of the total population of the group, has around 64.36% of the total cases for the group. This is roughly 6.85 times its proportional share and earns an “F-(minus)” (young Sammy dropped BELOW an “F- minus” one day last week and had to serve an inschool detention).

21-10-23 F2A - Worldometer TOP Active Cases TABLE.JPG
Extracted from Worldometer, here is the list of the 25 countries with the highest number of COVID-19 “Deaths per Million”. The US [#16] (up from #17 last week) is doing 2.52% better than Romania, but is doing 0.75% worse than Slovenia.

21-10-23 F3 - Worldometer TOP Deaths per Million TABLE.JPG
That table shows that those people who are panic mongering and claiming that the US has the world’s highest COVID-19 death rate either simply don’t know what they are talking about or are deliberately attempting to spread false information. <SARC>Since

There are -20- -19- -18- -17- -16- 15 COUNTRIES that have a HIGHER “DEATHS per MILLION” rate than the US does.
That means (according to the Florida OFFICE OF THE Former PRESIDENT OF THE UNITED STATES OF AMERICA [and its authorized representatives – ROOMS TO RENT – contact “Donnie” at 1-900-968-3658]) that the US is doing better than any other country and that that is all due to the inspired leadership of Donald John Trump {BBHN}.

As you can plainly see, from that table, almost all of the countries with higher “Deaths per Million” counts than the US has have those so-called “Universal Healthcare Insurance” programs and that is definitive proof that those so-called “Universal Healthcare Insurance” programs are ineffective and result in the deaths of millions because of their reliance on Death Panels to ration healthcare (unlike the US where you get all the healthcare that you can pay for out of your own pocket [at rates determined by totally unbiased actuaries and CFOs {solely concerned with maximizing profit <AND who already have really great healthcare insurance plans as part of their employment>}]) </SARC>.​
 
***********************************************

BLOCK 7 – US States DATA and CORRELATIONS
Mortality Measurements

***********************************************

The fact that the total number of US deaths continues to rise isn’t going to surprise anyone other than Dr. Mashmont who jusknowz that the ABSOLUTE MAXIMUM number of COVID-19 deaths peaked out at 10,300 and that there hasn’t been a single COVID-19 death in the US since April 4, 2020.

The "Mashmont Theory" appears to be that the world's medical community and every other government in the world are all lying about the impact of COVID-19 on the people of the world AND that they are doing so specifically to make God, Mr. Trump, and **D*O*C*T*O*R** Mashmont (not necessarily in that order) look bad.

21-10-23 G1 - Total US Deaths GRAPH.JPG
Updated to the past 24 hours, the US (with approximately 4.26% of the world’s population) has had approximately 18.97% of the world’s COVID-19 cases. That is a disparity of 4.45 :: 1 (which is an “F”). It also has 15.25% of the world’s COVID-19 deaths, which is a disparity of 3.58 :: 1 (which is an “E-“).

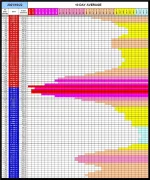
A more easily grasped illustration <SARC>(with almost all of those confusing numbers removed [and brightly colored {- IF the space that the date is in is filled in in RED, that means that Donald John Trump {BBHN} was still legally recognized as the President of the United States of America BUT IF the space the date is in is filled in in BLUE, that means that the US government is fraudulently under the control of a purported so-called "President" because the REAL RESULTS of the 2020 election have been hidden from WE the People -}] so that even the innumerate followers of **D*O*C*T*O*R** Mashmont can follow it) </SARC> of what the "Daily Death Rate" (using the Friday numbers [and those since the last weekly update] for simplicity) is doing in the US is

21-10-23 G2 - The Fading of the Green TABLE.JPG
The US rate is going back up due to the fact that “Claque Failed Casino Operator” convinced a whole lot of people that they didn’t need to get vaccinated because [1] everyone else was doing is so they didn’t have to and [2] there was no reason to fear the spread of COVID-19 because everyone was getting vaccinated and it really wasn’t all that serious (if it existed at all). That increase IS going to continue if "Claque Failed Casino Operator" is successful in its campaign to ensure that the current administration does not succeed in bringing the US out of the current situation (a campaign which they are waging REGARDLESS of the actual effects on the American people because the ONLY thing that "Claque Failed Casino Operator" is concerned with is ensuring that it rules America).

(Doesn’t it suck that I have more faith in the US and [most of] its people [and wish them both more good fortune] than the members of “Claque Failed Casino Operator” do?)

When only the “Top 25” countries are looked at, then the US with around 9.39% of the total population, has around 18.31% of the “Total Deaths”, which is a letter grade of “D”.

21-10-23 F5A - Worldometer TOP TOTAL deaths TABLE.JPG
 
***********************************************

BLOCK 8 – VACCINATIONS

***********************************************

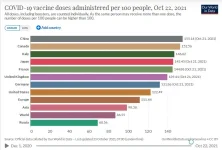
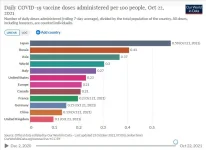
The US is still in the #8 position (at 84.12% of Japan [#4], 83.54% of Italy [#3], 80.29% of Canada [#2], and 78.95% of China [#1]) with respect to the “Number of vaccinations per capita”. Canada, with 83.47% of the population over 12 years old fully vaccinated, is running out of people to vaccinate).

21-10-23 H1 - COVID Vaccinations TOTAL per 100 BAR GRAPH.JPG
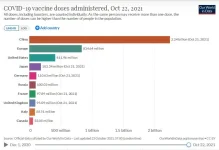
The US (the only country that Pfizer has not reduced deliveries to) is still #2 with respect to total vaccinations.

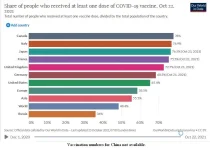
However the US (still in 8th place – behind Germany, the UK, Japan, France, China, Italy, and Canada) has vaccinated around 66.24% of its (NON-colonial) population (at least with one shot). China reported vaccinating around 76.2% on 18 SEP 21) and has not reported this datum since then.

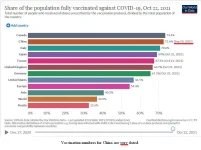
The US (still in 8th place – behind Japan, Germany, the UK, France, Italy, Canada, and China) has completely vaccinated around 57.28% of its (non-COLONIAL) population.

On balance, the US administrations (Federal and State) are still (considering the intransigence of some segments of the American population [and the actual efforts to sabotage it by others]) doing a pretty good job (as opposed to the “one heckuva job” they were doing prior to 20 JAN 21) as the US “Mortality Rate (Closed)” is now back up to 119.30% of the Canadian rate. As long as the US doesn’t run out of people willing to be vaccinated it should be in good shape (however it is now pretty obvious that the US IS running out of people willing to get vaccinated).

The US purchased enough vaccine to inoculate (two injections per person) at least 125% of its total population. Since approximately 30% of the US population has already decided that they will NOT get vaccinated, that means that the US now has at least 166.66% of the vaccine needed to inoculate all Americans who are willing to be vaccinated (which it appears to be running out of) and so the US government is giving away the vaccine that it purchased but didn’t need to the countries where thousands have died because they couldn’t get any vaccine due to the US government hoarding it.

"Claque Failed Casino Operator" is demanding that the current (illegal) so-called "administration" **D*O** **S*O*M*E*T*H*I*N*G** about this "waste of taxpayers’ money" (read as “Trump {BBHN} would have bought more AND then sold them for a bigger profit.”).

21-10-23 H2 - COVID Vaccinations TOTAL BAR GRAPH.JPG
For DAILY per capita vaccinations, Japan continues to hold the #1 slot. The US (at 85.19% of the Italian [#3], 56.10% of the Russian [#2], and 39.66% of the Japanese [#1] rates) is back “off the podium” [at #4].

21-10-23 H3 - COVID Vaccinations DAILY RATE per 100 BAR GRAPH.JPG
The situation APPEARS to be that it isn't so much other countries increasing their rates of vaccination (although they are doing that as well [Canada has given 88.64% of its population over 12 years old at least one shot and fully vaccinated 83.47% where as the US numbers are ~78.00% and ~67.00% respectively {some states do not report this metric}]) as it is that the US (which has LOTS of vaccine and LOTS of places where you can get vaccinated) is simply running out of people who are willing to get vaccinated. The people who aren't getting vaccinated appear to be working on the assumption that they will never encounter another non-vaccinated person and so there will be no chance of them contracting COVID-19. In gambler's terms, that's like betting, repeatedly, everything you own on something where the odds are 3.5 to 1 in your favour but the payout is only 1 for 1,000,000. If you don't understand that, what it means is that you will "win" a whole lot of the time, but you only have to lose once in order to be busted.

These disparities MAY increase as other countries find sources of supply that are not American owned and/or devoting almost all of their production to the US (which has already contracted for more vaccine than is required to vaccinate every single person in the United States of America IF the US does what it says and donates the surplus vaccine it has purchased to countries which couldn’t get enough because the US was buying it all up.​
 
***********************************************

BLOCK 9 – IMMUNIZATION LEVELS

(and other stuff)

***********************************************

Now that Israel is back on one of the “Top 25” lists (“Cases per Million”), you can expect to see

The Friends of The Real Chosen People
resurrecting their “Every single non-Jewish person in the entire world is, and forever more will remain, collectively guilty for what the Germans (none of whom [as well as most of their kids] are still living, but who cares) did so everyone has to give Israel whatever it demands on its terms IMMEDIATELY.” -whining- claim.)

The US is running EIGHTH [the same as last week] (at 85.49% of the Japanese [#4], ??.??% of the Chinese [#3] (data not in yet), 85.04% of the Italian [#2], and 83.85% of the Canadian [#1] levels) for the share of its population that has received a single dose of COVID-19 vaccine

21-10-23 K1 - VACCINATION SINGLE SHOT.JPG
When it comes to providing full vaccination, the US [#8] is doing slightly worse. The US has fully vaccinated 81.88%as much of its population as much as Japan [#4], 80.03% as much as Italy [#3] , 77.82% as much as China [#2], and 76.98% as much as Canada [#1] BUT simply trounces Russia by having 1.73 times as much of its population fully vaccinated. (The US IS still looking over the wrong shoulder – while the American people bicker over the colour of the artificial surface of the track!)

21-10-23 K2 - VACCINATION FULL SHOT.JPG
The disparity between the “One Shot” and “Full Shot” rates can possibly be explained by the fact that the US had a “lock” on the vaccines that only required a single dose to be effective (and would not license them for production outside of the US) while other countries were forced to rely on vaccines that required two doses for full effectiveness AND because the US concentrated on “Full Vaccination” rather than “Maximum Vaccination” – but that’s just an EWAG.

=================================================================================================================
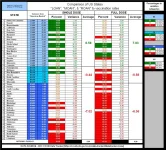
Here is the latest data comparing the several states vaccination rates with their “LOAN”, “MOAN”, and “ROAN” status. The data on vaccination rates comes from the CDC website’s COVID Tracker (digging down two levels). See the “General Notes” and the notes for other blocks to see how “LOAN”, “MOAN”, and “ROAN” status is determined.

If you see a relationship between "tending to the (American) left" and "likely to be vaccinated" or between "tending to the (American) right" and "likely not to be vaccinated", there isn't much I can do about that (but I would suspect that you could count past 20 [in public] without getting arrested). Of course, if you don't then there isn't much that I can do about that either.


RED numbers indicate values that are 5+% WORSE than the national average.
BLUE numbers indicate values that are within ±5% of the national average.
GREEN numbers indicate values that are 5+% BETTER than the national average.

21-10-23 K3 - VACCINATION VARIANCE.JPG
 
***********************************************

BLOCK 10 – COVID-19 “BURDEN”
(and other stuff)

***********************************************

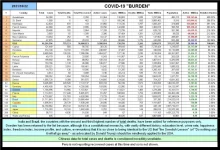
Since dead people do not require any medical supplies, medical personnel, medical facilities, or vaccinations, they really are not (crass and heartless as it sounds) a “burden” in any logistical sense.

That means that, when you consider ONLY the living, the following picture with regard to the “Top 20” plus the “G-8+China” group emerges.

21-10-23 I1 - COVID Burden - ACTIVE per MILLION TABLE.JPG
As you can see, of the "G-8+China" group, only the UK ( #12 - with just over 75% of the “COVID burden” of the US) and the US (#9) are in the “Top 20”. The US is now doing better than Suriname. The average “COVID Burden” for the “G-8+China” countries is 23.76% of the US rate. EXCEPT for the US and China it is 16.26% of the US rate and for the countries EXCEPT the US, China, and the UK it is 6.45% of the US rate.

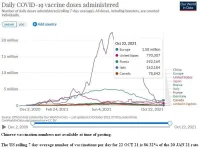
The daily vaccination rate in the US is down (by about 13.68%) from the 20 JAN 21 rate and is down by about 77.21% from its peak rate of 3.38 million per day.

"Claque Failed Casino Operator" (while still refusing to get vaccinated to ensure that sufficient Americans die and the current administration fails in its efforts to combat COVID-19) is still gloating its infantile

"Therelyin’ an Bidenzfailin’
- toljaso -

Therelyin’ an Bidenzfailin’
- TOLJASO -


Therelyin’ an Peopleardyin an Bidenzfailin’
- Hooray -


Therelyyin’ an Peopleardyyin’ an Bidenzfaailin’,
- HOORAY -


Therelyyyyin’ an Peopleardyyyyin’ an Bidenzfaaaailin’,
HOORAY!!!!
HOORAY!!!!
HOORAY!!!!

mantra to accompany their sniveling

<WHINY VOICE>Idza lyin’hoxe an EvrewunELSE bedderged vaxinated so I kin gotothuh Wurld Champeenship WetTeShirt Allstar NASCAR Dancin' wid Aprendis Survivers uv thuh Grade Amerucun Monsder TruckanTracder Demulishun Derby BBQ & Beer Celebration paaarrrrddeeeee like I godda KONSDITUSHUNUL ritetado.</WHINY VOICE>”.
It appears that there are a large number of people who are taking the position “I won’t get vaccinated because I don’t have to get vaccinated, because everyone else is getting vaccinated, so I don’t need to get vaccinated.”. For some reason they don’t appear to quite understand the logical fallacy involved.

21-10-23 H4c - COVID Vaccinations DAILY RATE TOTAL GRAPH.JPG
The US (46,264,596 cases [526,011 new in the past week {smaller increase than last week}], 755,721 deaths [11,841 new in the past week], and 138,709 C/M [up 1,562 from last week {smaller increase than last week}]) no longer beats Guadeloupe but does beat Israel (1,321,894 cases, 8,039 deaths, and 141,743 C/M, and is now only the 17th worst performer on the "Cases per Million" list). BUT, the US continues to REALLY do better than Montenegro with its 139.963 cases, 2,.057 deaths, and 222,811 C/M).

No one from “Claque Failed Casino Operator” was available for comment this week as they were all attending the “Gerrymandering, Voter Suppression, Stupid Law Suits, Ridiculous Lies, and Other Really Neat Ways to Destroy an Electoral System So That You Always Win” symposium sponsored by the International League of Isolationist Nations – not even off the record.

The US IS doing better than Montenegro*, The Seychelles*, Andorra*, Gibraltar*, Georgia* (“Yes, Virginia, there is a country named after a US state.”), San Marino*, Czechia*, St. Barth*, The Maldives*, Bahrain*, Slovenia*, Aruba*, Lithuania*, French Guiana*, French Polynesia*, and Israel* (countries marked with asterisks are all “Socialist” and have those so-called “Universal Healthcare Programs”), thus proving the superiority of NOT having a “Universal Healthcare Program) – right?

21-10-23 F4 - Worldometer TOP TOTAL Cases per Million TABLE.JPG
You might have noticed from that last table how, sometimes, measures that LOOK like they make sense for comparison purposes don't quite actually do so.​
 
***********************************************

BLOCK 11 – ODDS AND SODS
(and other stuff)

***********************************************

Comparing “chance of death” (a combination of “chance of infection” and “mortality rate) to “ability to pay” (PPP GDP per capita) and “previous support for healthcare system” (per capita spending on health care), the data is indicative that the US could have done considerably better than it actually did.

Italy is well back into the ±5% of the US on “raw deaths” AND continues to gain ground. In fact, of the 27 measures, the Italian “raw death” one is THE ONLY ONE that is not more than 5% better than the US number.

21-10-23 G3a - Death by ABILITY to Pay TABLE.JPG
Is there some “HUMOUNGOUSLY HUGE JUMP” in the US death and infection rates?

Doesn’t look like it from here.

Is the current administration REALLY doing as badly as the out gone administration?

Well, this is what the COVID-19 situation looked like while Mr. Trump was the President of the United States of America

21-10-23 B2a - Trump Daily Deaths GRAPH.JPG
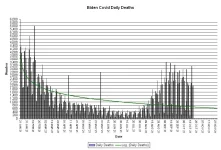
And this is what the COVID-19 situation looked like AFTER Mr. Trump was no longer the President of the United States of America

21-10-23 B2b - Biden Daily Deaths GRAPH.JPG
The trend lines on those two graphs are almost identical except for one thing – one goes up (indicating a worsening condition) and one goes down (indicating an improving condition). Independent laboratory testing has shown that 99.94% of the members of “Claque Failed Casino Operator” were unable to identify which graph had the trend line that was going up (and indicating a worsening condition).

PS – For those who are following along, the number of US COVID-19 deaths is 72.665 “Mashmont-D”s and the number of US COVID-19 cases is 355.882 “Mashmont-C”s.

[A “Mashmont-D” is equal to 10,400 and a “Mashmont-C” is equal to 130,000.]

NOTE
If you have noticed slight changes in the numbers between “Block 1” and the end of the weekly summary (and there SOMETIMES are changes) that is because both Worldometers and Ourworldindata are constantly updating their tables & charts so the numbers that they report later in the day (read as “for the later blocks”) can have increased. The amount of effort required to INCREASE the numbers in the earlier blocks by the small amount of change in the four plus hours it takes to do the weekly update so that they are consistent with the later blocks interferes with my caffeine intake – so don’t expect me to do it UNLESS you pay me, of course.

PS - All requests for custom STATISTICAL graphics, like all prayers, are answered. Of course, sometimes that answer is "No." and you never know if the answer is "Yes." until the graphic actually arrives.​
 
State comparison charts show red states continue to kick blue state butt in higher cases and deaths per million pop and lower vax rates, proving their vaccine response plan of mandates against guidelines and encouraging defiance of vax is working just fine, thank you.

Damn!! And I thought that I made sarcastic posts.
 
=================================================

*!*!* IMPORTANT NOTICE *!*!*


Despite the belief of some forum members that every single government in the world is lying about the effects of COVID-19 and that they are doing so as their contribution to the great huge enormous hidden secret covert conspiratorial loony crazy left-wing liberal socialist pinko fascist COMMIE plot to make DONALD JOHN TRUMP {BBHN} look bad, steal the 2020 election from Him and deny His legally entitled claim to DONALD JOHN TRUMP {BBHN} whom God guided Americans into ACTUALLY choosing as THE REAL PRESIDENT OF THE UNITED! STATES! OF! AMERICA! so that THE UNITED! STATES! OF! AMERICA! could fulfill its God Mandated role as the Saviour of Mankind in order that those plotting conspirators can impose Sherry Law (with its mandatory same-sex, inter-racial, marriages and forced murders of all white, male, pre-born, children AND compulsory autism causing vaXXinations [with those so-called "vaXXines" {that really contain mind-control microchips}]) on America so that all the Cheerleaders would have to wear Burke Hats and football would be banned because it uses pig skin - the truth is that


THERE IS NO SUCH CONSPIRACY

AND

WE DO NOT EXIST!


View attachment 67358497

For more information, contact
Billy-Bob Bilderburg
Vice-President Truthful Public Information
@
BBB-nognomes.zurich.org
or
Комната сто один
Rue Schaub 24, 1202 Genève, Switzerland
or
+41 22 734 79 55

=================================================

GENERAL ADVICE FOR DEALING WITH COVID-19

The best advice anyone can give you is

HAVE THE RIGHT ATTITUDE

View attachment 67358499

AND

View attachment 67358500

TAKE IT!

OH YES, AND


................\|||/...............
...............
(0 o)...............
.....
,-------ooO-()------------,....
....
|..........PLEASE..........|...
.....
|......DON'T FEED…...|....
.....
|.....THE TROLLS.....|....
.....
'---------------Ooo-------'....
.............
|__|__|.............
..............
|| ||..............
.............
ooO Ooo.............
==============================================================


You perpetuate the lie of "pigskin". Other than that, you're dead on.

Do feed the trolls...facts. However, to trolls, it's like having a tablespoon of cod liver oil. Good for your health (intellectual in the case of facts) but has a disgusting taste because trolls abhor fact.
 
Today's
QUIK-EE-REVU®

24 OCT 21

<SARC>

WELCOME TO McCOVID’s – OVER 46,000,000 SERVED

NOTICE – Applications are now being accepted for the “I Helped Make Sure That MORE THAN 750,000 Americans Died” medal. Forward all completed application forms to BOX 666. 1100 S Ocean Blvd, Palm Beach, FL 33480, USA.

</SARC>
Enough of the snark.

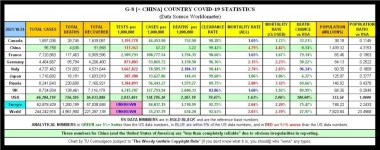
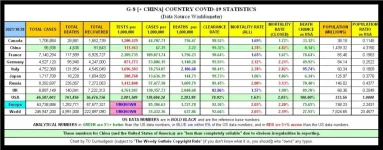
In “Cases per Million”, “Deaths per Million”, “Clearance Rate”, and “Chance of Death”, the US healthcare system continues to under perform in comparison with those of the other countries in the “G-8+China” group, an aggregated “Europe”, and an aggregated “World” The US does, however have a lower “Mortality Rate (Closed)” than six of the ten areas.

21-10-24 A1 - G8 + CHINA COVID TABLE.JPG
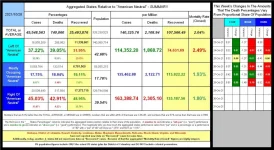
The “ROAN” states continue to under perform the remaining states and the nation as a whole with respect to their percentages of both cases and deaths when compared to their percentage of the population of the country and the split between the states that are performing reasonably (those in the “LOAN” states) and those that are acting like dolts (those in the “ROAN” states) continues to widen:

21-10-24 D2a - Red vs Blue - States by Color Sort Summary TABLE.JPG
Other than Rhode Island joining the “70+% Fully Vaccinated” club yesterday, there has been no significant change on “the vaccination front” – the “LOAN” states continue to vaccinate people and the “ROAN” states continue to have people die because they won’t get vaccinated – however, it appears possible that Maine will join that group before the end of next week.

HOWEVER, on the brighter side,

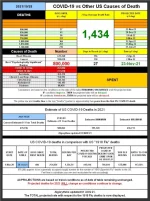
[1] it doesn’t look like “The Red Team” (which, officially, never existed) is going to make its quota (which, officially never existed) and have 900,000 Americans die before New Year’s Day (but might make 1,000,000 by St. Patrick’s Day [if “The Red Team” had ever existed, which Donald John Trump {BBHN} says it never did {and who am I to doubt His Word]).

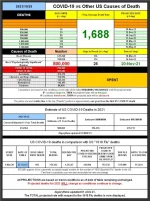
21-10-24 A2 - COVID vs Other Causes TABLE.JPG
AND

[2] the US

[1] continues to do a huge 3.35% better than Romania – that’s almost double yesterday’s lead - (and only 0.66% worse than Slovenia) with respect to “Deaths per Million”;

[2] continues to do a massive 2.18% better than Israel – expect demands for “humanitarian aid” (in the form of munitions and military hardware) to arrive shortly - (but only 1.22% worse than Estonia) with respect to “Cases per Million”;

[3] mortality rate (which is 119.26% of the Canadian one) continues to fluctuate around 2.055%;

[4] rolling seven day average US daily death continues to drop;

[5] number of daily deaths continues to (allowing for the cyclic pattern arising from the fact that a lot of people in a lot of states don't think that what happens on the weekends is worth bothering to report as it happens) to improve;

and

[6] performance (that looks like it) increased significantly will continue to look that way for the next couple of days as the states take the weekend off and don’t bother to send in the data which makes their performances look as bad as it actually is.

<SARC>So who says that the US healthcare system isn’t competitive with that of the other “powerhouse” nations? </SARC>

(More charts and graphs at Daily Statistical Summary of COVID-19 – FULL REPORT ON SATURDAYS)
 
And the beat goes on...
 
Today's
QUIK-EE-REVU®

25 OCT 21

<SARC>

WELCOME TO McCOVID’s – OVER 46,000,000 SERVED

NOTICE – Applications are now being accepted for the “I Helped Make Sure That MORE THAN 750,000 Americans Died” medal. Forward all completed application forms to BOX 666. 1100 S Ocean Blvd, Palm Beach, FL 33480, USA.

</SARC>
Enough of the snark.

If you factor in “Ability to Pay” (GDP per capita) and “Support for Healthcare System” (per capita amount spent on health care) then the US healthcare system continues to under perform in comparison with those of the other countries in the “G-8+China” group, an aggregated “Europe”, and an aggregated “World” – in fact out of the countries that make up the “G-8+China” group a person picked at random has the highest chance of dying from COVID-19 if they are picked from the United States of America. This despite the fact that the US does, however have a lower “Mortality Rate (Closed)” than six of the ten areas – can you figure out why?

21-10-25 G3b - Death by ABILITY to Pay SHORT TABLE.JPG
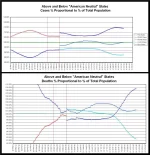
The “ROAN” states continue to under perform the remaining states and the nation as a whole with respect to their percentages of both cases and deaths when compared to their percentage of the population of the country and the split between the states that are performing reasonably (those in the “LOAN” states) and those that are acting like dolts (those in the “ROAN” states) continues to widen as this graph shows:

21-10-25 D2d - Red vs Blue - Combined Cases and Deaths GRAPH.JPG
Other than Maine Island joining the “70+% Fully Vaccinated” club a couple of days ago, there has been no significant change on “the vaccination front” – the “LOAN” states continue to vaccinate people and the “ROAN” states continue to have people die because they won’t get vaccinated – however, it appears possible that Maine will join that group before the end of next week.

HOWEVER, on the brighter side,

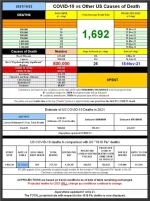
[1] it doesn’t look like “The Red Team” (which, officially, never existed) is going to make its quota (which, officially never existed) and have 900,000 Americans die before New Year’s Day (but might make 1,000,000 by St. Patrick’s Day [if “The Red Team” had ever existed, which Donald John Trump {BBHN} says it never did {and who am I to doubt His Word}]).

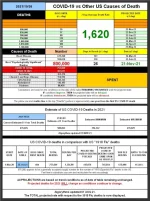
21-10-25 A2 - COVID vs Other Causes TABLE.JPG
AND

[2] the US

[1] continues to do a huge 4.01% better than Romania – that’s up almost 0.50% from yesterday - (and only 0.49% worse than Slovenia) with respect to “Deaths per Million”;

[2] continues to do a massive 2.21% better than Israel – expect demands for “humanitarian aid” (in the form of munitions and military hardware) to arrive shortly - (but only 0.56% worse than Estonia) with respect to “Cases per Million”;

[3] mortality rate (which is 119.27% of the Canadian one) continues to fluctuate around 2.055%;

[4] rolling seven day average US daily death continues to drop (Well, who can really tell when only 23.53% of the states report fully?);

[5] number of daily deaths continues to (allowing for the cyclic pattern arising from the fact that a lot of people in a lot of states don't think that what happens on the weekends is worth bothering to report as it happens) to improve;

[6] rolling seven day average number of vaccinations per day, when normalized for population size, stands at 164.17% of the Chinese rate;

and

[7] performance (that looks like it) increased significantly will continue to look that way for the next couple of days since the vast majority of the states take the weekend off and don’t bother to send in the data which makes their performances look as bad as it actually is.

<SARC>So who says that the US healthcare system isn’t competitive with that of the other “powerhouse” nations? </SARC>

(More charts and graphs at Daily Statistical Summary of COVID-19 – FULL REPORT ON SATURDAYS)
 
***********************************************

BLOCK 6 – THE “TOP 25”s

***********************************************


Of the 25 countries with the highest number of TOTAL cases, the US, with around 9.10% of the total population of the group, has around 18.57% of the total cases for the group. This is roughly 1.98 times its proportional share and earns a “D“.​

Of the 25 countries with the highest number of currently ACTIVE cases, the US, with around 9.39% of the total population of the group, has around 64.36% of the total cases for the group. This is roughly 6.85 times its proportional share and earns an “F-(minus)” (young Sammy dropped BELOW an “F- minus” one day last week and had to serve an inschool detention).​

Extracted from Worldometer, here is the list of the 25 countries with the highest number of COVID-19 “Deaths per Million”. The US [#16] (up from #17 last week) is doing 2.52% better than Romania, but is doing 0.75% worse than Slovenia.

That table shows that those people who are panic mongering and claiming that the US has the world’s highest COVID-19 death rate either simply don’t know what they are talking about or are deliberately attempting to spread false information. <SARC>Since​

There are -20- -19- -18- -17- -16- 15 COUNTRIES that have a HIGHER “DEATHS per MILLION” rate than the US does.

That means (according to the Florida OFFICE OF THE Former PRESIDENT OF THE UNITED STATES OF AMERICA [and its authorized representatives – ROOMS TO RENT – contact “Donnie” at 1-900-968-3658]) that the US is doing better than any other country and that that is all due to the inspired leadership of Donald John Trump {BBHN}.

As you can plainly see, from that table, almost all of the countries with higher “Deaths per Million” counts than the US has have those so-called “Universal Healthcare Insurance” programs and that is definitive proof that those so-called “Universal Healthcare Insurance” programs are ineffective and result in the deaths of millions because of their reliance on Death Panels to ration healthcare (unlike the US where you get all the healthcare that you can pay for out of your own pocket [at rates determined by totally unbiased actuaries and CFOs {solely concerned with maximizing profit <AND who already have really great healthcare insurance plans as part of their employment>}]) </SARC>.​
Just to point out, when it comes to several of those countries, their numbers of testing and actual cases are highly suspect, such as India, Russia and China in specific.
 
Just to point out, when it comes to several of those countries, their numbers of testing and actual cases are highly suspect, such as India, Russia and China in specific.

I make it clear (see the weekly updates) - where I have some solid evidence to support the conclusion that the numbers for some countries (China and the US being the prime cases) are suspect. India doesn't make it into the "G-8+China" group and, so far, I have no reason to believe that the Russian numbers aren't the best available. Mind you, I wouldn't bet the farm that they are as accurate as (let's say) Australia's, Canada's, France's, or even Israel's numbers are.

If I had to categorize (which I don't), I'd put
[1] the Chinese numbers in the "incredibly suspect due to national government meddling" category (however see other Asian countries and note that they are NOT incredibly out of line with countries of similar "racial" demographics),​
[2] the US numbers in the "highly suspect due to state government meddling" (however see other European heritage countries and note that they are NOT incredibly out of line with countries of similar "racial" demographics),​
[3] the Indian numbers in the "suspect due to national incapacity for data collection",​
and​
[4] the Russian numbers in the "possibly suspect due to national government meddling and/or national incapacity for data collection" categories.​
 
More Americans have now died from COVID-19 than died due to -the Battle of Gettysburg (7,058), the H1N1 flu (12,469), the Revolutionary War (~25,000), the Normandy Campaign (29,204), influenza in an average year (~35,000)- the Korean War (36,516).

The next ”Grim Mortality Milestone” is the number of deaths -from the H1N1 flu, the Revolutionary War, the Normandy Campaign, influenza in an average year, the Korean War (36,516)- in the Vietnam War (58,209).
How do you know all those soldiers died in the Battle of Gettysburg? Sure, the doctor may have seen a bullet and decided "Cause of death right there" but what if the soldier had a pre-existing condition?

/sarcasm
 
Today's
QUIK-EE-REVU®

26 OCT 21

<SARC>

WELCOME TO McCOVID’s – OVER 46,000,000 SERVED

NOTICE – Advance applications are now being accepted for the “I Helped Make Sure That MORE THAN 800,000 Americans Died” medal. Forward all completed application forms (plus a non-refundable $22.37 for shipping and handling) to BOX 666. 1100 S Ocean Blvd, Palm Beach, FL 33480, USA.

</SARC>
Enough of the snark.

The US healthcare system continues to under perform in comparison with those of the other countries in the “G-8+China” group, an aggregated “Europe”, and an aggregated “World” – in fact out of the countries that make up the “G-8+China” group a person picked at random has the highest chance of dying from COVID-19 if they are picked from the United States of America. This despite the fact that the US does, however have a lower “Mortality Rate (Closed)” than six of the ten areas – can you figure out why?

21-10-26 A1 - G8 + CHINA COVID TABLE.JPG
The “ROAN” states continue to under perform the remaining states and the nation as a whole with respect to their percentages of both cases and deaths when compared to their percentage of the population of the country and the split between the states that are performing reasonably (those in the “LOAN” states) and those that are acting like dolts (those in the “ROAN” states) continues to widen as this table shows:

21-10-26 D2a - Red vs Blue - States by Color Sort Summary TABLE.JPG
The slowing of the rate that the gap increased over the weekend was likely due to the fact that only 24.51% of the states reported fully over the weekend. I mean, how likely is it that the new cases today would be 563.98% of the new cases yesterday (which they were) unless someone was screwing the pooch?

Other than Maine Island joining the “70+% Fully Vaccinated” club a couple of days ago, there has been no significant change on “the vaccination front” – the “LOAN” states continue to vaccinate people and the “ROAN” states continue to have people die because they won’t get vaccinated – however, it appears possible that Maine will join that group before the end of next week.

HOWEVER, on the brighter side,

[1] it doesn’t look like “The Red Team” (which, officially, never existed) is going to make its quota (which, officially never existed) and have 900,000 Americans die before New Year’s Day (but might make 1,000,000 by -St. Patrick’s- April Fool’s Day [if “The Red Team” had ever existed, which Donald John Trump {BBHN} says it never did {and who am I to doubt His Word}]).

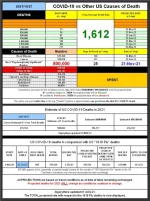
21-10-26 A2 - COVID vs Other Causes TABLE.JPG
AND

[2] the US

[1] continues to do a huge 4.23% better than Slovakia (and only 0.44% worse than Slovenia) with respect to “Deaths per Million”;

[2] continues to do a massive 2.00 better than French Polynesia (but only 0.14% worse than Estonia) with respect to “Cases per Million”;

[3] mortality rate (which is 119.04% of the Canadian one) continues to fluctuate around 2.055%;

[4] rolling seven day average US daily death continues to drop (Well, who can really tell when only 23.53% of the states report fully?);

[5] number of daily deaths continues to (allowing for the cyclic pattern arising from the fact that a lot of people in a lot of states don't think that what happens on the weekends is worth bothering to report as it happens) to improve;

and

[6] performance (that looks like it) increased significantly will continue to look that way for the next couple of days since the vast majority of the states take the weekend off and don’t bother to send in the data which makes their performances look as bad as it actually is.

<SARC>So who says that the US healthcare system isn’t competitive with that of the other “powerhouse” nations? </SARC>

(More charts and graphs at Daily Statistical Summary of COVID-19 – FULL REPORT ON SATURDAYS)
 
Today's
QUIK-EE-REVU®

27 OCT 21

<SARC>

WELCOME TO McCOVID’s – OVER 46,000,000 SERVED

NOTICE – Advance applications are now being accepted for the “I Helped Make Sure That MORE THAN 800,000 Americans Died” medal. Forward all completed application forms (plus the $149.99 non-refundable application fee) to BOX 666. 1100 S Ocean Blvd, Palm Beach, FL 33480, USA.

</SARC>
Enough of the snark.

The US healthcare system continues to under perform in comparison with those of the other countries in the “G-8+China” group, an aggregated “Europe”, and an aggregated “World” – in fact out of the countries that make up the “G-8+China” group a person picked at random has the highest chance of dying from COVID-19 if they are picked from the United States of America. This despite the fact that the US does, however have a lower “Mortality Rate (Closed)” than six of the ten areas – can you figure out why? When you normalize the data to take into account differing population sizes, then the cases and deaths look like this

21-10-27 z02 - G8 + China NORMALIZED TABLE.JPG
The “ROAN” states continue to under perform the remaining states and the nation as a whole with respect to their percentages of both cases and deaths when compared to their percentage of the population of the country and the split between the states that are performing reasonably (those in the “LOAN” states) and those that are acting like dolts (those in the “ROAN” states) continues to widen as these graphs show:

21-10-27 D2d - Red vs Blue - Combined Cases and Deaths GRAPH.JPG
Now that the “Weekend Slump” and the Monday “Bounce” are out of the way, it’s reasonably clear that the latest “wave” of cases/deaths has subsided. Will there be another? Will Trumplicans continue to ignore basic and safe methods of ameliorating the effects of COVID-19?

There has been no significant change on “the vaccination front” – the “LOAN” states continue to vaccinate people and the “ROAN” states continue to have people die because they won’t get vaccinated. Only Rhode Island, Vermont, Maine, and Connecticut have fully vaccinated more than 70% of their populations, Massachusetts MAY join that list in about a week.

HOWEVER, on the brighter side,

[1] it doesn’t look like “The Red Team” (which, officially, never existed) is going to make its quota (which, officially never existed) and have 900,000 Americans die before New Year’s Day (but might make 850,000 by Christmas Day [if “The Red Team” had ever existed, which Donald John Trump {BBHN} says it never did {and who am I to doubt His Word}]).

21-10-27 A2 - COVID vs Other Causes TABLE.JPG
AND

[2] the US

[1] continues to do a huge 4.13% better than Slovakia (and only 0.48% worse than Slovenia) with respect to “Deaths per Million”;

[2] continues to do a massive 0.78 better than Estonia (but only 2.58% worse than Guadeloupe) with respect to “Cases per Million” and is now only the 18th worst performer on this metric;

[3] mortality rate (which is 119.09% of the Canadian one) continues to fluctuate around 2.055%;

[4] rolling seven day average US daily death continues to drop (Well, who can really tell when only a maximum of 2/3rds of the states report fully?);

[5] number of daily deaths continues to (allowing for the cyclic pattern arising from the fact that a lot of people in a lot of states don't think that what happens on the weekends is worth bothering to report as it happens) to improve;

and

[6] performance (that looks like it) increased significantly will change to more accurately reflect what is actually happening for the next couple of days, and then go back to being off for the weekend.

<SARC>So who says that the US healthcare system isn’t competitive with that of the other “powerhouse” nations? </SARC>

(More charts and graphs at Daily Statistical Summary of COVID-19 – FULL REPORT ON SATURDAYS)
 
Today's
QUIK-EE-REVU®

28 OCT 21

<SARC>

WELCOME TO McCOVID’s – OVER 46,000,000 SERVED

NOTICE – Advance applications are now being accepted for the “I Helped Make Sure That MORE THAN 800,000 Americans Died” medal. Forward all completed application forms, plus the $149.99 non-refundable application fee, to BOX 666. 1100 S Ocean Blvd, Palm Beach, FL 33480, USA.
Check all 47 applicable boxes on the application form if you do not wish to make a $100 per month donation to the “Freedom and Liberty for Donald Trump” PAC.
</SARC>
The US healthcare system continues to under perform in comparison with those of the other countries in the “G-8+China” group, an aggregated “Europe”, and an aggregated “World” – in fact out of the countries that make up the “G-8+China” group a person picked at random has the highest chance of dying from COVID-19 if they are picked from the United States of America. This despite the fact that the US does, however have a lower “Mortality Rate (Closed)” than six of the ten areas – can you figure out why?

21-10-28 A1 - G8 + CHINA COVID TABLE.JPG
The “ROAN” states continue to under perform the remaining states and the nation as a whole with respect to their percentages of both cases and deaths when compared to their percentage of the population of the country and the split between the states that are performing reasonably (those in the “LOAN” states) and those that are acting like dolts (those in the “ROAN” states) continues to widen as these graphs show:

21-10-28 D2a - Red vs Blue - States by Color Sort Summary TABLE.JPG
It’s reasonably clear that the latest “wave” of cases/deaths has subsided. Will there be another? Will Trumplicans stop ignoring basic and safe methods of ameliorating the effects of COVID-19? Is the Pope Jewish?

There has been no significant change on “the vaccination front” – the “LOAN” states continue to vaccinate people and the “ROAN” states continue to have people die because they won’t get vaccinated. Only Rhode Island, Vermont, Maine, and Connecticut have fully vaccinated more than 70% of their populations, Massachusetts MAY join that list in about a week and Illinois may pass the 70% mark for single doses around the same time. No “ROAN” or “MOAN” states appear likely to pass a 70% mark soon.

HOWEVER, on the brighter side,

[1] it doesn’t look like “The Red Team” (which, officially, never existed) is going to make its quota (which, officially never existed) and have 900,000 Americans die before New Year’s Day (but might make 850,000 by then [if “The Red Team” had ever existed, which Donald John Trump {BBHN} says it never did {and who am I to doubt His Word}]).

21-10-28 A2 - COVID vs Other Causes TABLE.JPG
AND

[2] the US

[1] continues to do 3.98% better than Slovakia (and only 0.57% worse than Slovenia) with respect to “Deaths per Million”;

[2] continues to do a massive 1.16% better than French Polynesia (but only 2.45% worse than Guadeloupe) with respect to “Cases per Million” and is now only the 18th worst performer on this metric;

[3] (inclusive of colonial possessions) mortality rate (which is 119.12% of the Canadian one) continues to fluctuate around 2.055%;

[4] rolling seven day average US daily death continues to drop, but who can really tell when only a maximum of 2/3rds of the states report fully?);

[5] number of daily deaths continues to (allowing for the cyclic pattern arising from the fact that a lot of people in a lot of states don't think that what happens on the weekends is worth bothering to report as it happens) to improve;

and

[6] performance measures will become unreliable in a couple of days as most of the states don’t bother to report fully over the weekends.

<SARC>So who says that the US healthcare system isn’t competitive with that of the other “powerhouse” nations? </SARC>

(More charts and graphs at Daily Statistical Summary of COVID-19 – FULL REPORT ON SATURDAYS)
 

AND​
[2] the US​
[1] continues to do 3.98% better than Slovakia (and only 0.57% worse than Slovenia) with respect to “Deaths per Million”;​
[2] continues to do a massive 1.16% better than French Polynesia (but only 2.45% worse than Guadeloupe) with respect to “Cases per Million” and is now only the 18th worst performer on this metric;​
[3] (inclusive of colonial possessions) mortality rate (which is 119.12% of the Canadian one) continues to fluctuate around 2.055%;​
[4] rolling seven day average US daily death continues to drop, but who can really tell when only a maximum of 2/3rds of the states report fully?);​
[5] number of daily deaths continues to (allowing for the cyclic pattern arising from the fact that a lot of people in a lot of states don't think that what happens on the weekends is worth bothering to report as it happens) to improve;​
and​
[6] performance measures will become unreliable in a couple of days as most of the states don’t bother to report fully over the weekends.​


<SARC>So who says that the US healthcare system isn’t competitive with that of the other “powerhouse” nations? </SARC>

(More charts and graphs at Daily Statistical Summary of COVID-19 – FULL REPORT ON SATURDAYS)


Obviously, you load your post with comparison of stats that make the US look good. Which, I suppose, is your bias. Ex post facto SNARK warning.
 
Today's
QUIK-EE-REVU®

29 OCT 21

<SARC>

WELCOME TO McCOVID’s – OVER 46,000,000 SERVED

NOTICE – Advance applications are now being accepted for the “I Helped Make Sure That MORE THAN 800,000 Americans Died” medal. Forward all completed application forms, plus the $149.99 non-refundable application fee, to BOX 666. 1100 S Ocean Blvd, Palm Beach, FL 33480, USA.
Check all 47 applicable boxes on the application form if you do not wish to make a $100 per month donation to the “Freedom and Liberty for Donald Trump” PAC.
</SARC>
The US healthcare system continues to under perform in comparison with those of the other countries in the “G-8+China” group, an aggregated “Europe”, and an aggregated “World” – out of the countries that make up the “G-8+China” group a person picked at random has the highest chance of dying from COVID-19 if they are picked from the United States of America – if you “normalize” for “Ability To Pay” ("per capita GDP”) or “Healthcare System Support” (“per capita spending on healthcare”) it looks even worse.

21-10-29 G3b - Death by ABILITY to Pay SHORT TABLE.JPG
The “ROAN” states continue to under perform the remaining states and the nation as a whole with respect to their percentages of both cases and deaths when compared to their percentage of the population of the country and the split between the states that are performing reasonably (those in the “LOAN” states) and those that are acting like dolts (those in the “ROAN” states) continues to widen as these graphs show:

21-10-29 D2d - Red vs Blue - Combined Cases and Deaths GRAPH.JPG
It’s reasonably clear that the latest “wave” of cases/deaths has subsided. Will there be another? Will Trumplicans stop ignoring basic and safe methods of ameliorating the effects of COVID-19? Does the Sun rise in the West?

There has been no significant change on “the vaccination front” – the “LOAN” states continue to vaccinate people and the “ROAN” states continue to have people die because they won’t get vaccinated. Only Rhode Island, Vermont, Maine, and Connecticut have fully vaccinated more than 70% of their populations, Massachusetts MAY join that list in about a week and Illinois may pass the 70% mark for single doses around the same time. No “ROAN” or “MOAN” states appear likely to pass a 70% mark soon.

HOWEVER, on the brighter side,

[1] today is the first day that less than 1/3rd of the states have had less than 55% ratings for vaccinations so it doesn’t look like “The Red Team” (which, officially, never existed) is going to make its quota (which, officially never existed) and have 900,000 Americans die before New Year’s Day (but might make 850,000 by then [if “The Red Team” had ever existed, which Donald John Trump {BBHN} says it never did {and who am I to doubt His Word}]).

21-10-29 K3 - VACCINATION VARIANCE.JPG
AND

[2] the US

[1] continues to do 3.93% better than Slovakia (and only 0.66% worse than Slovenia) with respect to “Deaths per Million”;

[2] continues to do a massive 1.42 better than French Polynesia (but only 2.63% worse than Guadeloupe) with respect to “Cases per Million” and is now only the 18th worst performer on this metric;

[3] (inclusive of colonial possessions) mortality rate (which is 119.12% of the Canadian one) continues to fluctuate around 2.055% - exclusive of colonial possessions it continues to fluctuate around 2.045;

[4] rolling seven day average US daily death continues to drop, but who can really tell when only a maximum of 2/3rds of the states report fully?);

[5] number of daily deaths continues to (allowing for the cyclic pattern arising from the fact that a lot of people in a lot of states don't think that what happens on the weekends is worth bothering to report as it happens) to improve;

and

[6] performance measures will become unreliable in a couple of days as most of the states don’t bother to report fully over the weekends.

<SARC>So who says that the US healthcare system isn’t competitive with that of the other “powerhouse” nations? </SARC>

(More charts and graphs at Daily Statistical Summary of COVID-19 – FULL REPORT ON SATURDAYS)
 
Having exhausted the forum's graphics/post limit at the same time as I exhausted all of the data comparisons that "made the US look good", here, without further comment, are three other relevant graphics:

21-10-29 A1 - G8 + CHINA COVID TABLE.JPG
21-10-23 A2 - COVID vs Other Causes TABLE.JPG
21-10-29 B2b - Biden Daily Deaths GRAPH.JPG
 
Obviously, you load your post with comparison of stats that make the US look good. Which, I suppose, is your bias. Ex post facto SNARK warning.

Do you know how much WORK it is to find "stats that make the US look good"?
 
Do you know how much WORK it is to find "stats that make the US look good"?


You found them. Thanks to your hard work. The commie/socialist/lib/progressive/Democrat/naysayer/deniers are too lazy to look for the good in things that make America great. You provide evidence of fact that the good is there, but the commie/socialist/lib/progressive/Democrat/naysayer/deniers won't look because they are afraid of the truth. Ex post facto SNARK warning.
 
=================================================

*!*!* IMPORTANT NOTICE *!*!*

Despite the belief of some forum members that every single government in the world is lying about the effects of COVID-19 and that they are doing so as their contribution to the great huge enormous hidden secret covert conspiratorial loony crazy left-wing liberal socialist pinko fascist COMMIE plot to make DONALD JOHN TRUMP {BBHN} look bad, steal the 2020 election from Him and deny His legally entitled claim to DONALD JOHN TRUMP {BBHN} whom God guided Americans into ACTUALLY choosing as THE REAL PRESIDENT OF THE UNITED! STATES! OF! AMERICA! so that THE UNITED! STATES! OF! AMERICA! could fulfill its God Mandated role as the Saviour of Mankind in order that those plotting conspirators can impose Sherry Law (with its mandatory same-sex, inter-racial, marriages and forced murders of all white, male, pre-born, children AND compulsory autism causing vaXXinations [with those so-called "vaXXines" {that really contain mind-control microchips}]) on America so that all the Cheerleaders would have to wear Burke Hats and football would be banned because it uses pig skin - the truth is that

THERE IS NO SUCH CONSPIRACY

AND

WE DO NOT EXIST!


00 B1 PYRAMID.gif

For more information, contact
Billy-Bob Bilderburg
Vice-President Truthful Public Information
@
BBB-nognomes.zurich.org
or
Комната сто один
Rue Schaub 24, 1202 Genève, Switzerland
or
+41 22 734 79 55

=================================================

GENERAL ADVICE FOR DEALING WITH COVID-19

The best advice anyone can give you is

HAVE THE RIGHT ATTITUDE

00 B2 SAM and FRIEND.JPG

AND GET VACCINATED

AND

00 C GET VACCINATED.JPG

TAKE IT!

OH YES, AND


................\|||/...............

...............
(0 o)...............
.....
,-------ooO-()------------,....
....
|..........PLEASE..........|...
.....
|......DON'T FEED…...|....
.....
|.....THE TROLLS.....|....
.....
'---------------Ooo-------'....
.............
|__|__|.............
..............
|| ||..............
.............
ooO Ooo.............
==============================================================
 
GENERAL NOTES

If you have any dispute/discussion regarding the statistics, please feel free to link back to the latest post in the NEW THREAD that you start so that we can debate what your dispute/discussion is.

DATA SOURCE - COVID-19 Coronavirus Pandemic (at aprox. 1400 GMT the day of posting) except where noted.​

NOTE 1 –

“Mortality Rate (All)” appears to bear a one to one correlation to “[Mortality Rate (Closed)] x [Clearance Rate]”. That means that it is likely that the _real_ mortality rate is the “Mortality Rate (Closed)” and only the differing lengths of time from diagnosis to death is obscuring that.​

NOTE 2 –

Chinese figures are not accepted as reliable at this time. However they do not appear to be outside the parameters of countries with equivalent “Asian” population percentages.

US figures are not accepted as reliable at this time. However they do not appear to be outside the parameters of countries with equivalent “Racial” population percentages.​

SPECIAL EXPLANATORY NOTE 3 FOR GRADUATES OF “PIOOYA STATISTICS” CLASSES TAUGHT BY INNUMERATE DOLTS (who probably have a BA [Pla-Doh], a BS [Statistics], and a PhD [Finger Painting] from the University of Numerology)

  1. All charts employ a 30 day forward projection. (Thanks to “Jay59” for the upgrading suggestion.)
  2. Further suggestions to improve the accuracy of the PROJECTIONS are welcomed. “I don’t like the data or what generally accepted mathematical formulae say about the data – so you are full of crap.” comments will be ignored.
  3. Reported deaths normally take dips on weekends (which means the Sunday and Monday numbers are lower than the actual numbers of deaths and the Tuesday and Wednesday numbers are higher),
  4. Reported deaths normally take dips around “emotionally significant dates” (sometimes known as “The ‘Christmas’ Effect” or “The ‘Birthday’ Effect”).
  5. The trend lines are based on actual current and past data and are footed on the assumption that the conditions current as of the generation of the chart do not change.
  6. IF those conditions do change THEN the trend lines WILL change. This, unlike what some dolt will tell you, does NOT mean that the trend lines were wrong when calculated.
  7. Simply pulling numbers out of your butt or cherry-picking data, the way that some dolts do, and then using those PIOOYA numbers to claim expertise just doesn’t hack it in the real world (well, outside of Mar-a-Lago, Florida).

NOTE 4 – SPECIAL NOTES REGARDING TABLES AND GRAPHS CONCERNING U.S. STATES

  1. There are a whole lot of posts comparing "State X" against "States A, B, and C" without any acknowledgement that there are actually 50 states. (This is known as "cherry picking data" and I don’t do that.)
  2. The states have been ranked as to how far they vary from “The American Neutral” [which would be exactly 50% “Republican” (whatever that means) and 50% “Democrat” (whatever that means)] using the actual vote totals from the last Presidential, Senatorial, (Federal) Representative, and Gubernatorial elections plus the actual seat counts in the several states upper and lower chambers. The color coding indicates the relative position of the grouping to which each state belongs.
  3. Since blue is the traditional colour for “Conservative” and since all of the major American political parties rank as “Conservative” on the international scale, only various shades of blue are used.
  4. The totals are lower than the totals on Worldometer because US colonial possessions are excluded and only the actual US states are considered.

NOTE 5 –

How does the number of tests related to the "Mortality Rate"? It doesn't, and I'm no longer going to be posting that table routinely.​

NOTE 6 –

How does the NATIONAL “Population Density” relate to either the “Infection Rate” or the "Mortality Rate"? It doesn't, (with respect to specified areas inside countries it does, but I simply don’t have the facilities to deal with THAT much nitpicking) and I'm no longer going to be posting that table routinely.​
 
Back
Top Bottom