• This is a political forum that is non-biased/non-partisan and treats every person's position on topics equally. This debate forum is not aligned to any political party. In today's politics, many ideas are split between and even within all the political parties. Often we find ourselves agreeing on one platform but some topics break our mold. We are here to discuss them in a civil political debate. If this is your first visit to our political forums, be sure to check out the RULES. Registering for debate politics is necessary before posting. Register today to participate - it's free!

Daily and Weekly Statistical Summaries of COVID-19 NEW Thread

* * * Page 2 * * *

The US REMAINS as the -second- WORST country in terms of the total number of “Active Cases”​

HOWEVER, on the “brighter(?)” side,​
[1] the US 7 day average of 7 day averages for the number of “Daily Deaths” appears to have settled in to a “normal” state​

[2] while there has been no substantial change to the vaccination status of the several states.​

Using the new metrics, (and after finding, and fixing, a glitch)​
  • the “LOAN” states are 42.50% in the “RED” zone,
  • the “MOAN” states are 35.71 in the “RED” zone,
  • the “ROAN” states are 58.33% in the “RED” zone and, nationally,
  • the US is 49.02% in the “RED” zone.
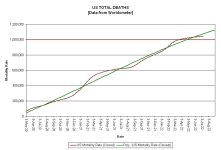
[3] Although “The Red Team” met its “1,000,000 Dead by “April Fool’s Day” goal with lots of room to spare it is struggling to make its new goal of “1,200,000 Dead by ‘National Harvey Wallbanger Day’” (08 NOV)” but it looks like it will need a strong dose of divine intervention to make it (rather than some later date). Will it? Stay tuned and find out..​
AND​
[5] the US​
(a) (Graded at D+) is doing 0.06% better than Brazil (but 1.35% worse than Gibraltar) and is the 17th worst country in the world with respect to “Deaths per Million”;​
(b) (Graded at C- ) is doing a massive 0.0010% better than Curaçao (and only 0.01% worse than Norway) with regard to “Cases per Million” and is the 60th worst country in the world on that metric – AND is OUT OF THE WORST QUARTILE.​

<SARC>
So who says that the US healthcare system (“the world’s best healthcare system”) which is doing much better than the 59 countries that have a commie “universal healthcare system” that are doing worse than it is isn’t competitive with that of the other “powerhouse” nations?
</SARC>

(c) “Mortality Rate (ALL) is a mere 109.70% (DOWN from last Thursday] of the Canadian one) which shows that (according to “Mashmontian Math”) the US is doing almost 2 times BETTER than Canada (because 109.70% is closer to 200.00% than it is to 0.00%) and the fact that the Canadian “Covid Burden” is a mere 91.16% of the US (AND since so 109.70% + 91.16% = 200.86% that simply reinforces that fact);​
and​
(d) number of daily deaths continues to (allowing for the cyclic pattern arising from the fact that a lot of people in a lot of states don't think that what happens on the weekends is worth bothering to report as it happens) appear to be improving.​

– FULLER REPORTS ON SATURDAYS –
Just to be clear you claimed that over 400,000 people in this country died from covid unnecessarily?
Had our jackass handled this appropriately most of those people would still be alive today.
That is why I view him as a mass murderer and it’s the reason I hate him, as I do all mass murderers.
 
Just to be clear you claimed that over 400,000 people in this country died from covid unnecessarily?
Just to be equally clear, I don't "claim" anything of the sort.

What I do do is post the numbers that show that if "A" had done what "B" did the results would have been "X", if "A" had done what "C" did the results would have been "Y" and if "A" had done what "D" did the results would have been "Z". I make no comment about whether there was a valid (or an invalid, for that matter) reason why "A" did not do what "B", "C", or "D" did.

To analogize, "A" (who has no legs) ran the marathon in 26 hours. However, if "A" did what "B" (who has one leg) did, then "A" would have run the marathon in 13 hours and if "A" did what "C" (who has two legs but is blind) did, then "A" would have run the marathon in 6.5 hours, and if "A" did what "D" (who has two legs and can see) did, then "A" would have run the marathon in 3.25 hours.
Had our jackass handled this appropriately most of those people would still be alive today.
Make that "been able to handle this appropriately" and I agree. That means that the question to be answered is "Why was "A" not able to handle COVID-19 appropriately?". When answering that question, it is important to remember that the actions of more than just "A" come into play.
That is why I view him as a mass murderer and it’s the reason I hate him, as I do all mass murderers.
That is your opinion and you are entitled to it.

Mind you, you might want to consider giving thanks that "A" was so inefficient at doing what he did do. Had "A" been totally successful in poo-pooing the whole situation and in convincing the American people that they should totally ignore what was happening, the actions of "A" would likely have resulted in a revoltingly high US death toll (rather than simply a horribly high one).
 
Today's
QUIK-EE-REVU®

TUESDAY 05 JUL 22

<SARC>
WELCOME TO McCOVID’s – OVER 89,000,000 SERVED
The McCOVID’s ”BIG XC contest tickets are OVER 50% GONE
BUT
LOTS are still available at all Big [R] outlets.

!!! HURRY – GET YOUR tickets NOW !!!
BUY SOME FOR YOUR KIDS, YOUR NEIGHBOURS, AND ALL YOUR RELATIVES

CONSERVATIVES
and all некультурный dolts

!*! REMAIN VIGILANT !*!

(or the bogyman will get you)
</SARC>

*********************************************************************************************

NOTE


The “Red”/”Blue”/”Green” color codes refer to the rates on this day of the week last week and are not NECESSARILY indicative of long term trends UNLESS associated with an average.
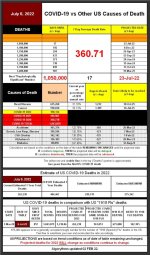
America’s performance against COVID-19 relative to the other “G-8+China” group remains consistently in the "Find someone else to blame for this crap and find them NOW!" area that it has been all along.

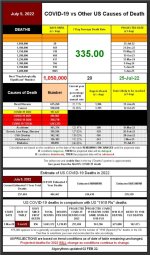
22-07-05 A2 - COVID vs Other Causes TABLE.JPG
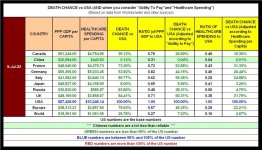
And, when you compare the results with the countries’ abilities to pay to fight COVID-19,

22-07-05 G3 - ABILITY TO PAY.JPG
the US results don’t look all that “Exceptional” either. [On average, the countries/areas (excluding China, for which the data is largely fictional) are doing 61.75% better than the US is doing with regard to the chance a person chosen at random has of dying from COVID-19 than a person chosen at random in the US does.]

There has been no substantial change to the vaccination status of the several states

22-07-05 J4 - STATE RELATIVE VAX RANK.JPG
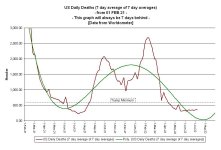
The seven day average deaths appear to have crested and to be inching downwards.

While it is true that if the US had followed “The Swedish Way” (which meant actually getting vaccinated – so THAT wasn’t going to happen) that would have saved around 418,125 (last Tuesday it was 416,791) lives,

what the members of “Claque Failed Casino Operator” are actually saying is:

I’m OK with an additional 258,849 (last Tuesday it was 259,083) MORE Americans dying by going the ‘Swedish Way’ instead of ‘The Canadian Way’.
[A total of an extra 676,975 (last Tuesday it was 675,875) deaths.]

AND

I’m OK with an additional 541,774 (last Tuesday it was 541,291) MORE Americans dying
by going the ‘Swedish Way’ instead of ‘The Japanese Way’.
[A total of an extra 959,899 (last Tuesday it was 958,082) deaths.]

– BUT –

Them Kanookz, Japz an Sweedz are geddin vaxxuhnaded and I’M’ NOT GONNA DOODAT!”​
 
* * * Page 2 * * *
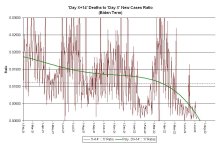
Even though the “14 days later” ratio (it takes about that long for someone to die from COVID-19 if they catch it) is still looking pretty good,

22-07-05 B2c2 - 14 Day Behind Ratio BIDEN.JPG
the US “COVID Burden” still looks uncomfortably bad because it LOOKS like the TIME FOR RECOVERY of the new cases SEEMS to be increasing.

Back into the “Worst 25” for “COVID-19 Burden” are:
  • France #21,
  • Germany #23, and
  • Italy #24,
with
  • the US #40, and
  • Canada #41,
remaining in the worst quartile, while
  • the UK #57, and
  • Japan #97,
are out of the worst quartile but still in the worst half, with
  • Russia #106, and
just barely out of the worst half.

That leaves China (and its largely fictitious data) at #207 to complete the set.

22-07-05 H1 - COVID BURDEN.JPG
Sweden [NOT a G-8 country] is #115 and is safely into the best half.

Brazil, India, the ROK, and the DPRK have been added for interest’s sake only.

HOWEVER, on the “brighter(?)” side,

[1] The “Light At The End of the Tunnel” is that it appears that COVID-19 is running out of Trumpists to infect and kill (at least in the “Red” states).

[2] 42.50% of the “LOAN” states are in the “Green” zone, as are 7.14% of the “MOAN” states, 0.00% of the “ROAN” states, and 17.65% of all the states. That (35.00 + 7.14 + 0.00 + 16.67) equals 67.29% so that means that the US is closer to having 100% of its population vaccinated and boosted than Canada (with only 49.16% vaccinated and boosted [and when you apply the US/Canada exchange rate that 49.13% becomes a mere 36.87%]), thus, according to The University of Numberology, proving the total superiority of the American Healthcare System. And *D*O*C*T*O*R* Mashmont says that means that COVID-19 doesn’t exist in the US any more (if it ever did).

[3] “The Red Team” looks like it has a chance to meet its new goal of “1,200,000 Dead by ‘National Harvey Wallbanger Day’” (08 NOV)” but it looks like it will need a strong dose of divine intervention) make to it (rather than some later date - like National Fruitcake Day - ) so SEND YOUR PRAYER OFFERINGS to the Church of DJT NOW.

AND

[4] the US

(a) (Graded at D+) is doing 0.1121% better than Brazil (but 1.5138% worse than Gibraltar) and is STILL ONLY the 17th WORST country in the world with in “Deaths per Million”;

(b) (Graded at C-) is doing a massive 0.0071% better than Curaçao (and only 0.0026% worse than Saint Martin) and is the 59th WORST country in the world in “Cases per Million”. The US is now OUT OF THE BOTTOM QUARTILE and into the bottom THIRD.

<SARC>
So who says that the US healthcare system (“the world’s best healthcare system”) which is doing much better than the 58 countries that have a commie “universal healthcare system” that are doing worse than it is isn’t competitive with that of the other “powerhouse” nations?
</SARC>
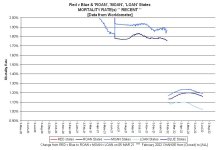
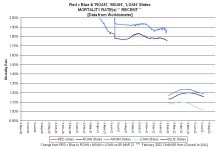
(c) “Mortality Rate (ALL) that had been rising again (more so in the “MOAN” and “ROAN” states) looks like it is starting to fall (which is a good sign) in all three groups of states. The drop is most noticeable in the “LOAN” states.

22-07-05 E3b - RvB Mortality RECENT GRAPH.JPG
This may be due to an increase in the severity of the lower number of new cases (but that’s an “EWAG”).

(d) “Mortality Rate” is ONLY 109.53% of the Canadian one, which shows that (according to “Mashmontian Math”) the US is doing almost 2 times BETTER than Canada [because 109.53% is closer to 200.00% than it is to 0.00%];

and

(e) number of daily deaths continues to (allowing for the cyclic pattern arising from the fact that a lot of people in a lot of states don't think that what happens on the weekends is worth bothering to report as it happens) improve.
– FULLER REPORTS ON SATURDAYS –
 
Just to be equally clear, I don't "claim" anything of the sort.

What I do do is post the numbers that show that if "A" had done what "B" did the results would have been "X", if "A" had done what "C" did the results would have been "Y" and if "A" had done what "D" did the results would have been "Z". I make no comment about whether there was a valid (or an invalid, for that matter) reason why "A" did not do what "B", "C", or "D" did.

To analogize, "A" (who has no legs) ran the marathon in 26 hours. However, if "A" did what "B" (who has one leg) did, then "A" would have run the marathon in 13 hours and if "A" did what "C" (who has two legs but is blind) did, then "A" would have run the marathon in 6.5 hours, and if "A" did what "D" (who has two legs and can see) did, then "A" would have run the marathon in 3.25 hours.

Make that "been able to handle this appropriately" and I agree. That means that the question to be answered is "Why was "A" not able to handle COVID-19 appropriately?". When answering that question, it is important to remember that the actions of more than just "A" come into play.

That is your opinion and you are entitled to it.

Mind you, you might want to consider giving thanks that "A" was so inefficient at doing what he did do. Had "A" been totally successful in poo-pooing the whole situation and in convincing the American people that they should totally ignore what was happening, the actions of "A" would likely have resulted in a revoltingly high US death toll (rather than simply a horribly high one).
Yet that is what your graph and accompanying comments suggest.
"Extra lives lost if American way and not the Swedish way: 417,000" is what you wrote, implying that had we in this country done what Sweden did that many lives could have been saved-whether the reason for not adopting a different approach was valid or not. I understand that CFCO wasn't totally responsible for all of those deaths. A lot of it had to do with the covidiot mentality here. However, he WAS the President at the onset of the pandemic. He did push useless medications and marched around maskless in public, modeling the kind of behavior that costs lives. He did push states to open prematurely and did not push the vaccines as hard as he could have. He made a lot of mistakes. I good deal of those extra deaths are blood on his hands.
So yes, that IS my opinion, that the jackass is a mass murderer because he contributed negligently to the deaths of tens of thousands if not hundreds of thousands of Americans.
 
Yet that is what your graph and accompanying comments suggest.
Indeed, and from those facts you are completely free to form whatever opinion you wish.
"Extra lives lost if American way and not the Swedish way: 417,000" is what you wrote, implying that had we in this country done what Sweden did that many lives could have been saved-whether the reason for not adopting a different approach was valid or not.
Yes, indeed, if the US had done what Sweden did that is what the result would have been.

Now, given ALL of the factors, is it realistic to say that the US could have done what Sweden did?
I understand that CFCO wasn't totally responsible for all of those deaths. A lot of it had to do with the covidiot mentality here.
Yep.
However, he WAS the President at the onset of the pandemic.
Yep.
He did push useless medications and marched around maskless in public,
Yep.
modeling the kind of behavior that costs lives.
Yep.
He did push states to open prematurely
Yep.
and did not push the vaccines as hard as he could have.
Yep.
He made a lot of mistakes.
Right. And it is impossible to commit murder "by mistake" (unless you were intending to kill someone else).
I good deal of those extra deaths are blood on his hands.
A good deal - yes. All - no.
So yes, that IS my opinion, that the jackass is a mass murderer because he contributed negligently to the deaths of tens of thousands if not hundreds of thousands of Americans.
I'd go along with "Mr. Trump was a jackass because he contributed negligently to the deaths of tens of thousands if not hundreds of thousands of Americans and a despicable jackass because he simply didn't give a damn about it as admitting that there was an actual problem would have made him look less than perfect.".
 
It actually is a crime in this country to commit negligent homicide, that is this: negligent homicide is a criminal charge brought against a person who, through criminal negligence, allows another person to die. I would submit that the jackass through his carelessness is guilty of this crime. He was more concerned with getting re-elected than with the pandemic, consistently ignoring the advice of the doctors and scientists he had access to. He could not have stopped covid from killing people here, but he certainly could have done a much better job at minimizing it.
Even if he had done everything right there would still likely be more deaths here than in most developed countries because there are too many people with a covidiot mentality......my FREEDUMB includes the ability to infect other people without their permission. Idiots.
 
It actually is a crime in this country to commit negligent homicide, that is this: negligent homicide is a criminal charge brought against a person who, through criminal negligence, allows another person to die. I would submit that the jackass through his carelessness is guilty of this crime.
Not a sufficiently direct connection to reliably obtain a conviction, therefore no prosecution, therefore no trial, therefore no finding of guilt, therefore he is **I*N*N*O*C*E*N*T**, therefore those deaths never happened at all - or such is the line of "logic" that the members of "Claque Failed Casino Operator" follow.
He was more concerned with getting re-elected than with the pandemic, consistently ignoring the advice of the doctors and scientists he had access to.
So it would most certainly appear.
He could not have stopped covid from killing people here, but he certainly could have done a much better job at minimizing it.
True, once the grammar is adjusted. As stands, it would have been pretty difficult for Mr. Trump to have minimized the impact of COVID-19 much more than he did when he told the nation that COVID-19 was "no big deal" and that it would "vanish in a couple of weeks".
Even if he had done everything right there would still likely be more deaths here than in most developed countries because there are too many people with a covidiot mentality......my FREEDUMB includes the ability to infect other people without their permission. Idiots.
Sadly, I have to agree with you on that one.
 
Today's
QUIK-EE-REVU®

WEDNESDAY 06 JUL 22

<SARC>
WELCOME TO McCOVID’s – OVER 89,000,000 SERVED
The McCOVID’s ”BIG XC tickets are now on sale, and are available at all ”Big [R]” locations.
!!! HURRY – GET YOUR tickets NOW !!!
*** Surprise the kids with your gift that they will remember all their lives! ***

CONSERVATIVES and all некультурный dolts
!*! REMAIN VIGILANT !*!
(or the bogyman will get you)
</SARC>


*********************************************************************************************

NOTE


The “Red”/”Blue”/”Green” color codes refer to the rates on this day of the week last week and are not NECESSARILY indicative of long term trends UNLESS associated with an average.
America’s performance against COVID-19 relative to the other “G-8+China” group remains consistently in the "The Cubs have the same chance of winning the Pennant this year as they had last year." area that it has been all along.

22-07-06 A2 - COVID vs Other Causes TABLE.JPG
The CURRENT number of projected COVID-19 deaths for 2022 is 64.83% (UP from last week) of what it was on 01 JAN 22.

But the relative rates

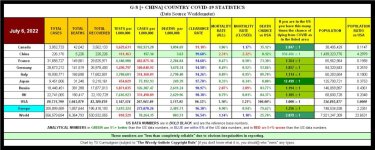
22-07-06 A1 - G8 + CHINA COVID TABLE.JPG
don’t really look happy making.

There has been no substantial change to the vaccination status of the several states.

The seven day average deaths appears to have plateaued. Is this about what we can expect on a steady basis – just like any other disease. Or is there going to be another spike?

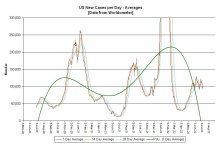
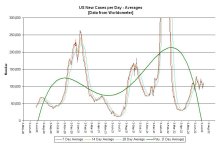
The US “New Cases per Day” graph (even with the slow down in the US vaccination rate) looks like there is a chance that a corner has been turned.

22-07-06 C3 - US NEW CASES per day 7-14-28 GRAPH.JPG
(trend line is now a 5th order polynomial [it gives a better match to the data]) and so does the “14 days later” ratio (it takes about that long for someone to die from COVID-19 if they catch it) but the US “COVID Burden” still looks uncomfortably bad.

Back into the “Worst 25” for “Covid Burden” are
  • France at #21,
  • Germany at #23, and
  • Italy at #24,
Out of 209 reporting countries:
  • the US is at #39, and
  • Canada (to round out the WORST quartile) is at #41.
Out of the bottom quartile, but still in the worst half are
  • the UK at #56,
  • Japan at #95,
    and
  • Russia at #105,
(leaving out the mostly invented Chinese data).

Sweden [NOT a G-8 country] is at #119 and firmly into the top half.

Those numbers are RELATIVE numbers and the actual “burden” appears to be decreasing due to the decrease in the severity of the average case (as indicated by the decline in the mortality rates).

The “Light At The End of the Tunnel” that sort of showed that COVID-19 was running out of Trumpists to infect and kill (except in the “ROAN” states) is somewhat dimmer.​
 
* * * Page 2 * * *
While it is true that if the US had followed “The Swedish Way” (which meant actually getting vaccinated – so THAT wasn’t going to happen) that would have saved around 418,633 (last week it was 417,119) lives, what the members of “Claque Failed Casino Operator” are actually saying is:

I’m OK with an additional 258,642 (last week it was 259,016) MORE Americans dying by going the ‘Swedish Way’ instead of ‘The Canadian Way’.
(A total of an EXTRA 677,275 [last week it was 676,135] deaths.)

AND

I’m OK with an additional 541,728 (last week it was 541,003) MORE Americans dying
by going the ‘Swedish Way’ instead of ‘The Japanese Way’.
(A total of an EXTRA 960,361 [last week it was 958,122] deaths.)

– BUT –

Them Kanookz, Japz an Sweedz are geddin vaxxuhnaded and I’m NOT GONNA DOODAT!
HOWEVER, on the “brighter(?)” side,

[1] When you add up the percentages for “LOAN”, “MOAN”, “ROAN”, and “All” states (42.50% + 7.14% + 0.00% + 17.65% = 67.29%) you find that 67.29% of them are “IN THE GREEN” and, *D*O*C*T*O*R* Mashmont [whose calculations are totally verified by the BS (Statistics) program at The University of Numberology] says that means that COVID-19 doesn’t exist any more (if it ever did) since 67.29% is closer to 100% than it is to 0.00%.

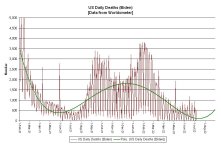
[2] “The Red Team” is struggling to make its new goal of “1,200,000 Dead by ‘National Harvey Wallbanger Day’” (08 NOV)” but it looks like it will need a strong dose of divine intervention) make to it (rather than some later date. (Any rumor that it was ever trying for any earlier date is typical left-wing, socialist, fascist, lying propaganda pushed by the commies who want to destroy America and turn it into a shit-hole third world country with that so-called “Universal Healthcare Insurance”.) But the current trend line

22-07-06 B2a3 - Daily Deaths BIDEN Years GRAPH.JPG
is against “Team Trump” in its “valiant effort” to rehabilitate President Trump’s predictions about the severity of COVID-19. The trend line for this graph is now a 5th order polynomial (it gives a better match to the data).

AND

[3] the US

(a) (Graded at D+) is doing 0.1121% better than Brazil (but 1.5691% worse than Gibraltar) and is the 17th worst country in the world with respect to “Deaths per Million”;

(b) (Graded at C-) on “Cases per Million

22-07-06 F4 - WORST 54 CASES per MILLION.JPG
is doing a massive 0.0051% better than Curaçao (and only 0.0045% worse than Saint Martin) with regard to “Cases per Million” and is ONLY the 59th worst country in the world on that metric (but still in the bottom third).

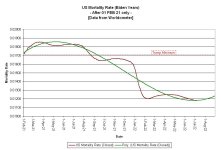
(c) “Mortality Rate (ALL)” appears to be SLOWLY decreasing.

22-07-06 B1c - Mortality Rate BIDEN Years GRAPH.JPG
This is driven, primarily, by the "LOAN" and "MOAN" states as the rate in the “ROAN” states continues to climb.

However it is a mere 109.37% of the Canadian one) shows that (according to “Mashmontian Math”) the US is doing almost 2 times BETTER than Canada [because 109.37% is closer to 200.00% than it is to 0.00%];

and

(d) number of daily deaths continues to (allowing for the cyclic pattern arising from the fact that a lot of people in a lot of states don't think that what happens on the weekends is worth bothering to report as it happens) appear to be improving.

AND

(e) had (according to the last report from the head of the B.S. [Statistics] program at The University of Numberology) only an average of 275.06 deaths per day from COVID-19 while Mr. Trump was in office but has had an average of 1,254.79 deaths per day from COVID-19 while Mr. Biden has been in office, thus proving that Mr. Trump was 4.5618774085654039118737729949829 times better at dealing with COVID-19 that Mr. Biden has been.
– FULLER REPORTS ON SATURDAYS –
 
Today's
QUIK-EE-REVU®

THURSDAY 07 JUL 22

<SARC>
WELCOME TO McCOVID’s – OVER 89,000,000 SERVED
The McCOVID’s ”BIG XC tickets are on sale – AND are OVER 90% GONE!!!!!
!!! SUPPORT TRUMP !!! – GET YOUR tickets NOW !!!

CONSERVATIVES and all некультурный dolts
!*! REMAIN VIGILANT !*!
(or the bogyman will get you)
</SARC>


*********************************************************************************************

NOTE


The “Red”/”Blue”/”Green” color codes refer to the rates on this day of the week last week and are not NECESSARILY indicative of long term trends UNLESS associated with an average.
America’s performance against COVID-19 relative to the other “G-8+China” group remains consistently in the

“Hey! So we’re an NFL team and we tied the East Cupcake High School second string team.
It could have been worse.
sense that it has been all along.

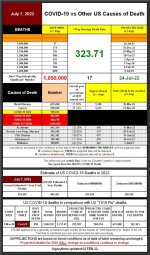
22-07-07 A2 - COVID vs Other Causes TABLE.JPG
The US “New Cases per Day” graph looks encouraging, and so does the “14 days later” (it takes about that long for someone to die from COVID-19 if they catch it) ratio but the US “COVID Burden” still looks uncomfortably bad.

Back into the “Worst 25” are
  • France at #21,
  • Germany at #22, and
  • Italy at #23,
Out of the “Worst 25” but still in the “Worst Quarter” are
  • the US at #39,
  • Canada at #42, and
  • the UK at #48.
Still in the bottom half – but out of the bottom third - are
  • Japan #87, and
  • Russia #105.
(Sweden [NOT a G-8 country] is at #106 and is BACK IN the bottom half [#106 or worse]).

The “Light At The End of the Tunnel” is that it appears that (except in the “ROAN” states) COVID-19 is running out of Trumpists to infect and kill.

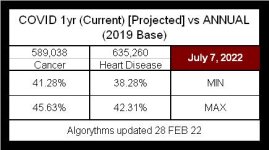
While COVID-19 is the THIRD (projected) cause of death this year in the US, the projected high rates are LESS than 46% of those for both Heart Disease and Cancer.

22-07-07 A4 - CURRENT v 2019 ANNUAL.JPG
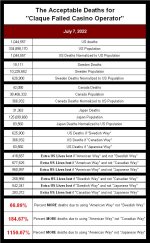
While it is true that if the US had followed “The Swedish Way” (which meant actually getting vaccinated – so THAT wasn’t going to happen) that would have saved around 418,657 (last Thursday it was 417,041) lives, so what the members of “Claque Failed Casino Operator” are actually saying is:

I’m OK with an additional 258,968 (last Thursday it was 259,833) MORE Americans dying by going the ‘Swedish Way’ instead of ‘The Canadian Way’.
[A total of an EXTRA 677,625 (last Thursday it was 676,874) deaths.]

and

I’m OK with an additional 542,341 (last Thursday it was 541,963) MORE Americans dying by going the ‘Swedish Way’ instead of ‘The Japanese Way’.
[A total of an EXTRA 960,997 (last Thursday it was 959,004) deaths.]

– BUT –

Them Kanookz, Japz an Sweedz are geddin vaxxuhnaded and I’M NOT GONNA DOODAT!

22-07-07 H2 - ACCEPTABLE DEATHS.JPG
 
* * * Page 2 * * *
The US REMAINS as the -second- WORST country in terms of the total number of “Active Cases”

22-07-07 F3 - WORST 54 ACTIVE CASES.JPG
HOWEVER, on the “brighter(?)” side,

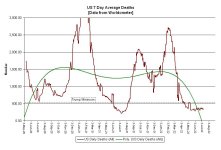
[1] the US 7 day average of 7 day averages for the number of “Daily Deaths” appears to have settled in to a “normal” state

22-07-07 B2b2 - 7 Day Average of 7 Day Averages BIDEN GRAPH.JPG
[2] while there has been no substantial change to the vaccination status of the several states.

22-07-07 J3 - STATE VAX RATES.JPG
Using the new metrics, (and after finding, and fixing, a glitch)
  • the “LOAN” states are 42.50% in the “RED” zone,
  • the “MOAN” states are 35.71 in the “RED” zone,
  • the “ROAN” states are 60.42% in the “RED” zone and, nationally,
  • the US is 47.06% in the “RED” zone.
[3] Although “The Red Team” met its “1,000,000 Dead by “April Fool’s Day” goal with lots of room to spare it is struggling to make its new goal of “1,200,000 Dead by ‘National Harvey Wallbanger Day’” (08 NOV)” but it looks like it will need a strong dose of divine intervention to make it (rather than some later date). Will it? Stay tuned and find out..

AND

[5] the US

(a) (Graded at D+) is doing 0.1121% better than Brazil (but 1.6808% worse than Gibraltar) and is the 17th worst country in the world with respect to “Deaths per Million”;

(b) (Graded at C- ) is doing a massive 0.0056% better than Curaçao (and only 0.0125% worse than Bermuda) with regard to “Cases per Million” and is the 60th worst country in the world on that metric – AND is OUT OF THE WORST QUARTILE.

<SARC>
So who says that the US healthcare system (“the world’s best healthcare system”) which is doing much better than the 59 countries that have a commie “universal healthcare system” that are doing worse than it is isn’t competitive with that of the other “powerhouse” nations?
</SARC>
(c) “Mortality Rate (ALL) is a mere 109.27% (DOWN from last Thursday] of the Canadian one) which shows that (according to “Mashmontian Math”) the US is doing almost 2 times BETTER than Canada (because 109.27% is closer to 200.00% than it is to 0.00%) and the fact that the Canadian “Covid Burden” is a mere 91.31% of the US (AND since so 109.27% + 91.31% = 200.58% that simply reinforces the fact that the US is doing twice [verified by The University of Numberology] as well as Canada);

and

(d) number of daily deaths continues to (allowing for the cyclic pattern arising from the fact that a lot of people in a lot of states don't think that what happens on the weekends is worth bothering to report as it happens) appear to be improving.
– FULLER REPORTS ON SATURDAYS –
 
Today's
QUIK-EE-REVU®

FRIDAY 08 JUL 22

<SARC>
WELCOME TO McCOVID’s – OVER 90,000,000 SERVED
The McCOVID’s "BIG XCI" contest tickets are now on special.
Buy one for yourself and get another for your family for FREE.
!!! SUPPORT **P*R*E*S*I*D*E*N*T** TRUMP !!!
!!! GET YOUR tickets NOW !!!

CONSERVATIVES and all некультурный dolts
!*! REMAIN VIGILANT !*!
(or the bogyman will get you)
</SARC>


*********************************************************************************************

NOTE


The “Red”/”Blue”/”Green” color codes refer to the rates on this day of the week last week and are not NECESSARILY indicative of long term trends UNLESS associated with an average.
America’s performance against COVID-19 relative to the other “G-8+China” group remains as “efficient” (as the Red Army’s general staff’s conduct of WWII was) as it has been all along.

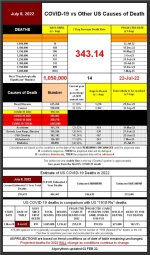
22-07-08 A2 - COVID vs Other Causes TABLE.JPG
There has been some slight change to the vaccination status of the several states as:
  • the “LOAN” states are 42.50% [~] in the “GREEN” zone,
  • the “MOAN” states are 57.14% [~] in the “YELLOW” zone,
  • the “ROAN” states are 58.33% [⇓] in the “RED” zone, and
  • the US (as a whole) is 46.08% [⇓] in the “RED”zone.
The seven day average deaths appear to have crested and to be inching downwards.

The US “New Cases per Day” and the "14 days later” graphs continue to look encouraging.

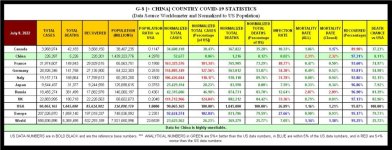
When you look at the normalized results for the “G-8+China” group, an aggregated Europe, and an aggregated World

22-07-08 A5 - G8+CHINA NORMALIZED.JPG
things don’t look any better.

And, the US is still the worst performing country in terms of “Total Cases”.

22-07-08 F1 - WORST 54 TOTAL CASES.JPG
It has 7.19% of the total population of the WORST Quartile countries and has 17.08% of the cases. That means that the US earns an E+ letter grade.

Remaining in the “Worst 25” for “COVID-19 Burden” are
  • France at #20,
  • Italy at #22, and
  • Germany at #23.
Out of the “Worst 25”, but still in the worst quartile are
  • the US at #40,
  • Canada at #42, and
  • the UK at #50.
Out of the bottom quartile but still in the bottom half are
  • Japan at #83, and
  • Russia at #105.
That ignores China’s mostly mythical numbers.
Sweden [NOT a G-8 country], is at #106 and is just barely out of the bottom half.

NOTE – Those are RELATIVE ratings and, as evidenced by the declining mortality rates, the ACTUAL burdens are highly likely to be falling.
 
* * * Page 2 * * *
A general overview of the situation regarding “ROAN”, “MOAN”, and “LOAN” states is

22-07-08 D0 - RED v BLUE TABLE.JPG
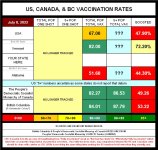
Or you might want to take your state’s data from the above and see how you are doing against the rest of the US and the Northern Commie Menace by putting it into this

22-07-08 J5 - US-CAN-BC VAX RATES.JPG
table. [Please not the impending change in the way that CDC (Canada) is going to be reporting. Personally, I agree that counting someone who got their second shot a year ago and has not had any booster shots since then as “fully vaccinated” is a bit of a pipedream so I have no problem with the change. Do you?]

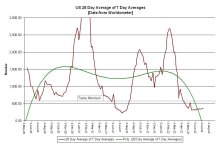
The “Light At The End of the Tunnel” is that, while it appears that COVID-19 is running out of Trumpists to infect and kill, the impact of COVID-19 appears to have leveled off into its “normal” rate.

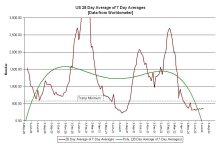
22-07-08 C2b - US 28 Day avg of 7 d.a. GRAPH.JPG
However, there is a possibility that what we are seeing now is that the effects of COVID-19 are settling in to a “historical norm”. We’ll just have to wait and see.

If the US had followed “The Swedish Way” (which meant actually getting vaccinated – so THAT wasn’t going to happen) that would have saved around 419,190 (last Friday it was 417,429) lives, so what the members of “Claque Failed Casino Operator” are actually saying is:

I’m OK with an additional 258,068 (last Friday it was 258,910) MORE Americans dying by going the ‘Swedish Way’ instead of ‘The Canadian Way’.
- A total of an EXTRA 677,258 DEATHS (last Friday it was 676,339). –

AND

I’m OK with an additional 542,292 (last Friday it was 541,920) MORE Americans dying
by going the ‘Swedish Way’ instead of ‘The Japanese Way’.
- A total of an EXTRA 961,482 DEATHS (last Friday it was 959,349).”

– BUT –

Them Kanookz, Japz an Sweedz are geddin vaxxuhnaded and I’M NOT GONNA DOODAT.”
AND, on the “brighter(?)” side,

[1] “The Red Team” says that its goal is (as it has always been) “1,100,000 DEAD BY National Harvey Wallbanger Day(08 NOV)” (but the wise might consider “a slightly later date” to be a safer bet).

AND

[2] the US

(a) (Graded at D+) is doing 0.1121% better than Brazil (but 1.6809% worse than Gibraltar) and is STILL ONLY the 17th worst country in the world with respect to “Deaths per Million”;

(b) (Graded at C-) is doing a massive 0.0056% better than Curaçao (and only 0.0125% worse than Bermuda) with regard to “Cases per Million”, is the 60th worst country in the world on that metric, and remains (safely?) out of the bottom quartile.

<SARC>
So who says that the US healthcare system (“the world’s best healthcare system”) which is doing much better than the 59 countries that have a commie “universal healthcare system” that are doing worse than it is isn’t competitive with that of the other “powerhouse” nations?)
</SARC>
(c) “Mortality Rate (ALL) is a mere 109.18% (DOWN from last Friday] of the Canadian one) which shows that (according to “Mashmontian Math”) the US is doing almost 2 times BETTER than Canada (because 109.18% is closer to 200.00% than it is to 0.00%) and when you add in (as the people at The University of Numberology do) the fact that the Canadian “Covid Burden” is 92.11% you realize that the US is doing 201.29% better than the socialist dictatorship that committed the 8/20 terrorist attack on Washington DC and is blocking America’s Manifest Destiny to have sovereignty over all of North America;

and

(d) number of daily deaths continues to (allowing for the cyclic pattern arising from the fact that a lot of people in a lot of states don't think that what happens on the weekends is worth bothering to report as it happens) appear to be improving.
– FULLER REPORTS ON SATURDAYS –
 
=================================================

*!*!* IMPORTANT NOTICE *!*!*
Despite the belief of some forum members that every single government in the world is lying about the effects of COVID-19 and that they are doing so as their contribution to the great huge enormous hidden secret covert conspiratorial loony crazy left-wing liberal socialist pinko fascist COMMIE plot to make DONALD JOHN TRUMP {BBHN} look bad, steal the 2020 election from Him and deny His legally entitled claim to DONALD JOHN TRUMP {BBHN} whom God guided Americans into ACTUALLY choosing as THE REAL PRESIDENT OF THE UNITED! STATES! OF! AMERICA! so that THE UNITED! STATES! OF! AMERICA! could fulfill its God Mandated role as the Saviour of Mankind in order that those plotting conspirators can impose Sherry Law (with its mandatory same-sex, inter-racial, marriages and forced murders of all white, male, pre-born, children AND compulsory autism causing vaXXinations [with those so-called "vaXXines" {that really contain mind-control microchips}]) on America so that all the Cheerleaders would have to wear Burke Hats and football would be banned because it uses pig skin - the truth is that

THERE IS NO SUCH CONSPIRACY!

AND

WE DO NOT EXIST!


00 B1 - PYRAMID.gif

For more information, contact
Billy-Bob Bilderburg
Vice-President Truthful Public Information
@
BBB-nognomes.zurich.org
or
Комната сто один
Rue Schaub 24, 1202 Genève, Switzerland
or
+41 22 734 79 55

=================================================

GENERAL ADVICE FOR DEALING WITH COVID-19

The best advice anyone can give you is

HAVE THE RIGHT ATTITUDE
00 B2  - SAM and FRIEND.JPG
AND GET VACCINATED
BECAUSE IF YOU DON’T THEN THIS IS GOING TO HAPPEN
00 B3 - UNVAXXED CEMETARY.JPG

TAKE IT!

OH YES, AND


................\|||/...............
...............
(0 o)...............
.....
,-------ooO-()------------,....
....
|..........PLEASE..........|...
.....
|......DON'T FEED…..|....
......
|.......THE TROLLS....|....
.....
'---------------Ooo-------'....
.............
|__|__|.............
..............
|| ||..............
.............
ooO Ooo.............
==============================================================
 
GENERAL NOTES

If you have any dispute/discussion regarding the statistics, please feel free to link back to the latest post in the NEW THREAD that you start so that we can debate what your dispute/discussion is.

DATA SOURCE - COVID-19 Coronavirus Pandemic (at aprox. 1400 GMT the day of posting) except where noted.
NOTE 1 –

“Mortality Rate (CLOSED)” is no longer being used due to the fact that a significant number (although not a majority yet) of US states do not report their number of recovered cases.
NOTE 2 –

Chinese data is NOT acceptable as reliable at this time due to significant questions about the reliability of reporting. However they do not appear to be outside the parameters of countries with equivalent “Racial” population percentages.
SPECIAL EXPLANATORY NOTE 3 FOR GRADUATES OF “PIOOYA STATISTICS” CLASSES TAUGHT BY INNUMERATE DOLTS (who probably have a BA [Pla-Doh], a BS [Statistics], and a PhD [Finger Painting] from the University of Numberology)
  1. All charts employ a 30 day forward projection. (Thanks to “Jay59” for the upgrading suggestion.)
  2. Further suggestions to improve the accuracy of the PROJECTIONS are welcomed. “I don’t like the data or what generally accepted mathematical formulae say about the data – so you are full of crap.” comments will be ignored.
  3. Reported deaths normally take dips on weekends (which means the Sunday and Monday numbers are lower than the actual numbers of deaths and the Tuesday and Wednesday numbers are higher),
  4. Reported deaths normally take dips around “emotionally significant dates” (sometimes known as “The ‘Christmas’ Effect” or “The ‘Birthday’ Effect”).
  5. The trend lines are based on actual current and past data and are footed on the assumption that the conditions current as of the generation of the chart do not change.
  6. IF those conditions do change THEN the trend lines WILL change. This, unlike what some dolt will tell you, does NOT mean that the trend lines were wrong when calculated.
  7. Simply pulling numbers out of your butt or cherry-picking data, the way that some dolts do, and then using those PIOOYA numbers to claim expertise just doesn’t hack it in the real world (well, outside of Mar-a-Lago, Florida).
NOTE 4 – SPECIAL NOTES REGARDING TABLES AND GRAPHS CONCERNING U.S. STATES
  1. There are a whole lot of posts comparing "State X" against "States A, B, and C" without any acknowledgement that there are actually 50 states. (This is known as "cherry picking data" and I don’t do that.)
  2. The states have been ranked as to how far they vary from “The American Neutral” [which would be exactly 50% “Republican” (whatever that means) and 50% “Democrat” (whatever that means)] using the actual vote totals from the last Presidential, Senatorial, (Federal) Representative, and Gubernatorial elections plus the actual seat counts in the several states upper and lower chambers. The color coding indicates the relative position of the grouping to which each state belongs.
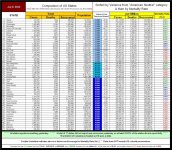
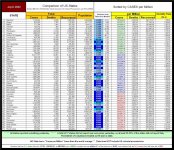
  3. Since blue is the traditional colour for “Conservative” and since all of the major American political parties rank as “Conservative” on the international scale, only various shades of blue are used.
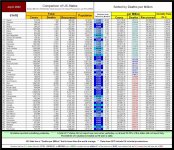
  4. The totals are lower than the totals on Worldometer because US colonial possessions are excluded and only the actual US states (plus the District of Columbia) are considered.
NOTE 5 –

How does the number of tests related to the "Mortality Rate"? It doesn't, and I'm no longer going to be posting that table – unless someone is dumb enough to say that it does.
NOTE 6 –

How does the NATIONAL “Population Density” relate to either the “Infection Rate” or the "Mortality Rate"? It doesn't, (with respect to specified areas inside countries it does, but I simply don’t have the facilities to deal with THAT much nitpicking) and I'm no longer going to be posting that table – unless someone is dumb enough to say that it does.​
 
***********************************************

BLOCK 1 - DATA and CORRELATIONS

***********************************************

Compare how the “G-8+China” group, an aggregated “Europe” and an aggregated “World” are doing vis-à-vis each other.

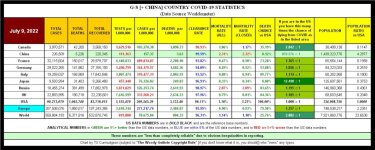
22-07-09 A1 - G8 + CHINA COVID TABLE.JPG
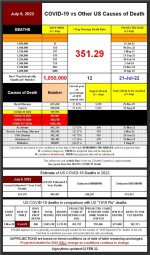
Projections based on the trends current as of the day of posting showing how COVID-19 is likely to progress, its likely total in its first year in the US, and comparing its effect with that of the “-Spanish- 1918 Flu”.

COVID-19 is now likely to kill ONLY 142.13% of the number of Americans that died from the “1918 Flu”.
The US “Mortality Rate (ALL)” is now at 108.99% of the Canadian one.

22-07-09 A2 - COVID vs Other Causes TABLE.JPG
COVID-19 remains the THIRD largest cause of death in the US (and isn’t likely to make it any higher [hopefully]).

At the current rate, the estimated rates for the “Low 365 Day” death count are 42.15% that of Cancer and is 39.08% that for Heart Disease, for the estimated “High 365 Day” death count, it is 46.59% that of Cancer and 43.20% that of Heart Disease.

The US rolling 7 day average number of deaths from COVID-19 had been MORE THAN FIVE times as high as the (2019 data) US average number of daily deaths from accidents but is now DOWN to just over 0.797 times as high.

The updated link to the "Grim Mortality Milestone” table shows that the next psychologically significant number is

* * * – 1,050,000 – * * *
IF the current trends continue, THEN this number will be reached on 21 JUL 22.

***********************************************
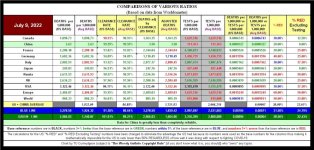
This table shows how well the various areas are doing with respect to both the US and the World after adjustments for various factors.

To see how well likely a random person in the “G-8+China” group, an aggregated “Europe” or an aggregated “World” is to die from COVID-19 (which is a combination of the answers to the questions “How likely am I to catch COVID-19?” and “If I do catch COVID-19, then how likely am I to die from it?”) as well as how well the areas are doing in respect of their (per capita) relative abilities to pay for fighting COVID-19 and with respect to the (per capita) amount that they previously spent on supporting their healthcare systems you will have to go to the Block 11 and look at the third table there.

22-07-09 A3 - Comparison of Ratios TABLE.JPG
 
***********************************************

BLOCK 2 - DATA


(WITH ARROWS [for the graduates of the BS {Statistics} program at The University of Numerology])

***********************************************

QUICK SUMMARY OF Comparative COVID-19 (Total Deaths/Total Cases) & Mortality Closed %
- Data source - COVID-19 Coronavirus Pandemic (at ~1400 GMT on the date of posting) -
-See “General Notes” for caveats as to accuracy of data and “Mortality Rate (Closed)” use.

22/03/26 – World (6,144,249/480,165,010) 1.28% [⇓] / USA (1,003,198/81,600,890) 1.23% [↭] / Canada (37,411/3,436,519) 1.09% [↭] (88.55% of the US rate)
22/04/02 – World (6,172,257/490,198,8510 1.26% [⇓] / USA (1,007,989/81,813,51) 1.23% [↭] / Canada (37,671/3,492,916) 1.08% [⇓] (87.54% of the US rate)
22/04/09 – World (6,200,046/197,937,844) 1.25% [⇓] / USA (1,011,665/82,034,738) 1.23% [↭] / Canada (37,977/3,560,840) 1.07% [⇓] (86.48% of the US rate)
22/04/16 – World (6,220,896/503,893,680) 1.23% [⇓] / USA (1,015,357/82,295,768) 1.23% [↭] / Canada (38,288/3,623,785) 1.06% [⇓] (85.64% of the US rate)
22/04/23 – World (6,241,039/508,747,383) 1.23% [↭] / USA (1,018,154/82,628,089) 1.23% [↭] / Canada (38,753/3,691,765) 1.05% [⇓] (85.19% of the US rate)
22/04/30 – World (6,259,716/512,989,378) 1.22% [⇓] / USA (1,020,660/83,037,059) 1.23% [↭] / Canada (39,230/3,746,284) 1.05% [↭] (85.19% of the US rate)
22/05/07 – World (6,275,052/516,685,846) 1.21% [⇓] / USA (1,024,386/83,534,060) 1.25% [⇑] / Canada (39,716/3,787,353) 1.05% [↭] (85.51% of the US rate)
22/05/14 – World (6,286,958/520,490,059) 1.21% [↭] / USA (1,026,527/84,174,521) 1.22% [⇓] / Canada (40,217/3,819,771) 1.05% [↭] (86.33% of the US rate)
22/05/21 – World (6,299,122/526,817,242) 1.20% [⇓] / USA (1,028,741/84,935,262) 1.21% [⇓] / Canada (40,664/3,844,725) 1.06% [⇑] (87.32% of the US rate)
22/05/28 – World (6,309,991/531,054,349) 1.19% [⇓] / USA (1,031,218/85,699,847) 1.20% [⇓] / Canada (40,967/3,863,121) 1.06% [↭] (88.13% of the US rate)
22/06/04 – World (6,319,326/534,857,504) 1.18% [⇓] / USA (1,033,369/86,450,603) 1.20% [↭] / Canada (41,235/3,880,100) 1.06% [↭] (88.91% of the US rate)
22/06/11 – World (6,330,220/539,912,196) 1.17% [⇓] / USA (1,035,675/87,246,309) 1.19% [⇓] / Canada (41,505/3,895,966) 1.07% [⇑] (89.74% of the US rate)
22/06/18 – World (6,339,816/543,779,885) 1.17% [↭] / USA (1,038,265/87,968,819) 1.18% [⇓] / Canada (41,723/3,910,211) 1.07% [↭] (90.41% of the US rate)
22/06/25 – World (6,349,700/548,317,082) 1.16% [⇓] / USA (1,040,641/88,708,703) 1.17% [⇓] / Canada (41,865/3,926,613) 1.07% [↭] (90.89% of the US rate)
22/07/02 – World (6,360,339/553,770,511) 1.15% [⇓] / USA (1,043,281/89,507,083) 1.17% [↭] / Canada (42,010/3,946,087) 1.17% [↭] (91.34% of the US rate)
22/07/09 – World (6,371,816/559,884,193) 1.14% [⇓] / USA (1,045,740/90,273,079) 1.16% [⇓] / Canada (42,200/3,970,571) 1.17% [↭] (91.75% of the US rate)

***********************************************
The “Rolling 7 day US average deaths per day” TODAY is 351.29 (LAST WEEKY REPORT it was 377.14).

“The Red Team” made its quota of “1,000,000 dead Americans by “April Fool’s Day”. What present will they have for “Labor Day”?

The states are being fairly good in reporting their number of recovered cases (the number of states not reporting “recovered” yesterday was 17 and the week’s low was 14.

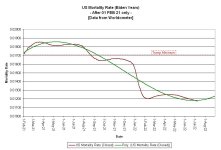
The “Mortality Rate (ALL)” is, essentially, unchanged from last week.

22-07-09 B1c - Mortality Rate BIDEN Years GRAPH.JPG
The number of deaths per day data continues to act “normally”. The graph indicates that the US is coming out of the last wave BUT because of poor vaccination response in the ROAN states could head into another”.

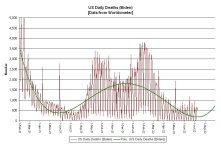
22-07-09 B2a3 - Daily Deaths BIDEN Years GRAPH.JPG
How are the major nations coping? This chart, from Our World in Data

WHICH WILL NO LONGER WORK FOR MY “LEGACY” SYSTEM,
SO YOU HAVE TO GO AND LOOK FOR YOURSELF
illustrates the relative growth rates of COVID-19 in those areas and the US continues to lead the pack.​
 
***********************************************

BLOCK 3 – TODAY’S “WAVE (TSUNAMI [?] / RIPPLE [?])” CHARTS

***********************************************


Today’s charts are based on Worldometer data as of ~1400 GMT on the day of posting)
The rolling "7 Day Average" death rate (351.29 today) is UP from the 224.86 that it was on 09 JUL 21. Will Mr. Biden be able to match Mr. Trump’s high of 3,531? After all Mr. Trump issued an EO to make it "vanish in a couple of weeks” (mind you, he didn’t specify WHICH "couple of weeks").

22-07-09 C1 - US 7 Day DEATH Averages - GRAPH.JPG
The rolling "14 Day Average of the 7 Day Averages" - which gives a much "cleaner" charting - death rate (364.21) is UP from the 252.07 that it was on 09 JUL 21. When the official word was that “COVID-19 isn’t anything to worry about.”.

22-07-09 C2b - US 28 Day avg of 7 d.a. GRAPH.JPG
The daily average of new cases for the past 28 days is 108,0990 (it was 109,160 in the last weekly report), for the past 14 days it is 111,741, (it was 109,876 in the last weekly report) and for the past 7 days it is 109,428 (it was 114,054 in the last weekly report)

22-07-09 C3 - US NEW CASES per day 7-14-28 GRAPH.JPG
Yesterday, the US, with around 4.23% of the world’s population accounted for about 16.12% of the world’s covid-19 cases. This is approximately 3.81 times its proportionate share..

The overall letter grade for the US this week is a “D”.

The indicators point to an increasing incidence and a decreasing mortality – UNLESS you live in a “ROAN” state in which case the second half doesn’t appear to apply.

Will people continue to stupidly ignore recommended safety measures and/or dying to prove their loyalty to Donald Trump {BBHN}? Is “Trump” merchandise made in China?


Draw your own conclusions from the charts and the facts NOT from the latest version of the currently operative, “officially” sanctioned, "Team SpreDispare" approved, CT-News issued, “truth-of-the-day” as delivered by OnAN, or FOX News, or “The Reliable Unimpeachable Totaly Honest News”​
 
***********************************************

BLOCK 4A – US States DATA and CORRELATIONS
IN TABLES

***********************************************


HOW IS YOUR STATE DOING?

All base data is from Worldometer as of ~1400 GMT on the date of posting.
NOTE – 1

The “Mortality Rate (Closed)” and “Recovered Rate” for many states are NOW reasonably reliable after the huge data dump over the last two weeks.
NOTE – 2

Only (17 states didn’t report the number of "Recovered" yesterday and the number has gone as low as 14 in the last week.
NOTE – 3

Neither Maryland’s nor Rhode Island’s “Recovered” and “Mortality Rate (Closed)” make any sense – however the sizes of the populations of those two states means that this doesn’t appear to have any significant effect on the whole of the US data – but I could be wrong.
NOTE – 4

The data presented respecting "Right Of American Neutral States", “Mostly Occupying American Neutral States” and "Left Of American Neutral States" is NOT to be taken as indicating that "'State X' is doing 'Y' because it is a '_[fill in the blank]_ State'. The tables and graphs show correlation ONLY, and NOT causation. The entirety of American political discourse is inextricably bound to a "My States" (read as “The REAL Americans”) vs. "Their States" (read as “The Destroyers of America”) dichotomy (or trichotomy if you prefer) and to ignore that fact is silly. To insist that that fact MUST be ignored simply because of the fact that you don't like it that a state is identified as being BOTH a "_[fill in the blank]_ State" and also producing data that you don't want to hear is even sillier.
NOTE – 5

The states have been ranked as to how far they vary from “The American Neutral” [which would be exactly 50% “Republican” (whatever that means) and 50% “Democrat” (whatever that means)].

[SEE “General Notes” for details]

If you don’t like that method, please provide some detailed (show your working) alternative method and I will consider it. Absent the production of such a detailed (show your working) proposal, you are just whining and will be ignored.
Here is how the states are doing – sorted by “American Neutral” category and them by “Mortality Rate (ALL)”

22-07-09 D1a1 - RED v BLUE (Top only) TABLE.JPG
and then sorted by “Cases per Million” only:

22-07-09 D1b - RED v BLUE CASES per MILLION (TABLE).JPG
and then sorted by “Deaths per Million” only:

22-07-09 D1c - RED v BLUE DEATHS per MILLION TABLE.JPG
Those are OK if you want to look up specific numbers, but, because they are “single data point” tables, they don’t actually show you what is happening over time. For that, see the next block.​
 
***********************************************

BLOCK 4B – US States DATA and CORRELATIONS
IN GRAPHS

***********************************************


HOW ARE THE "MY" AND "THEIR" STATES DOING?

All base data is from Worldometer as of ~1400 GMT on the date of posting.
The indicators in the Percentages column show how far (and in which direction) the aggregated states are from the statistical norm. For example, a X.xx% indicates that they are X.xx% away from the norm and on the "Good" side while a Y.yy% indicates that they are Y.yy% away from the norm and on the "Bad" side. NOTE - This is a PERCENTAGE difference and so a "30" in one column with a "40" in the population column will be "25%" and not "10%".

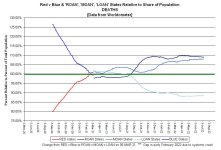
The “MOAN” and “ROAN” states are WORSE than their respective percentage of the population for shares for cases and deaths - the “LOAN” states are better.

Now ask yourself these questions:

(If a group of states has both its percentage of national cases and percentage of national deaths LOWER than its percentage of national population, would you say that that group of states is doing ___ better or ____ worse than the national average?)

(If a group of states has both its percentage of national cases and percentage of national deaths HIGHER than its percentage of national population, would you say that that group of states is doing ___ better or ____ worse than the national average?)

22-07-09 D2a - RvB CASES v POP GRAPH.JPG
The situation with respect to both “Cases per Million” and “Deaths per Million” is NOT “happy making”. In fact, NO STATE has a “Cases per Million” or “Deaths per Million” rate that is lower than the world average and the only reason why the US position isn’t significantly worse than it is is that the IMPROVEMENT in the “LOAN” state data is partially offsetting the DETERIORATION in the “ROAN” state data.

22-07-09 D2b - RvB DEATHS v POP GRAPH.JPG
As far as “Deaths per Million” goes, the results can be slightly confusing since some of the very small states have very low numbers of deaths but a high “Deaths per Million” rate.

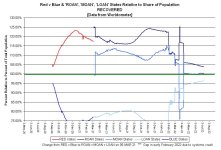
And then there are the "Recovered" numbers (which will take some time to sort themselves out into a coherent [but essentially meaningless] pattern after the massive data dumps of the last couple of weeks).

22-07-09 D2c - RvB RECOVER v POP GRAPH.JPG
 
***********************************************

BLOCK 5 – US States DATA and CORRELATIONS
Mortality Measurements

***********************************************


All base data is from Worldometer as of ~1400 GMT on the date of posting.
NOTE – 1

The data presented respecting "Right Of American Neutral States", “Mostly Occupying American Neutral States” and "Left Of American Neutral States" is NOT to be taken as indicating that "'State X' is doing 'Y' because it is a '_[fill in the blank]_ State'. The tables and graphs show correlation ONLY, and NOT causation. The entirety of American political discourse is inextricably bound to a "My States" vs. "Their States" dichotomy (or trichotomy if you prefer) and to ignore that fact is silly. To insist that that fact MUST be ignored simply because a state is identified as being BOTH a "_[fill in the blank]_ State" and also producing data that you don't want to hear about is even sillier.
NOTE – 2

See “General Notes” for how the states are categorized and what the colour codes mean.

If you don’t like that method, please provide some detailed (show your working) alternative method and I will consider it. Absent the production of such a detailed (show your working) proposal, you are just whining and will be ignored.
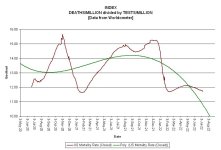
The “Mortality Index” indicates that the number of deaths and the number of tests are changing at disproportionate rates. It appears that testing is slowing faster than deaths are, so you cannot blame the increase in deaths on the increase in tests. However it does look like the "Mortality Index" is starting to dip that's a good sign. My suspicion is that the reason why the “Mortality Index” is not falling is that the emphasis has changed from reconnaissance (testing) to combat (vaccination).

22-07-09 E1 - INDEX (DpM div TpM).JPG
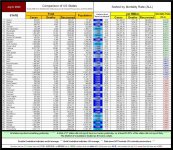
In table format, here is how the individual states are doing. While the "ROAN States" continue to dominate the list of states with lower mortality rates, they also have more cases. "What you gain on the swing, you lose on the roundabout."

22-07-09 E2 - RvB Mortality.JPG
And to give an overview of how states are doing here is that data reduced to a graph. NOTE - The only explanation that I can think of for the rather precipitous drop in the "LOAN" state number on 17 JUN 21 is that several states appear to have (finally) updated their "recovered" numbers. The Mortality Rate for the "LOAN" states now appears to make sense. This is what the recent “Mortality Rate (ALL) looks like for the three groups:

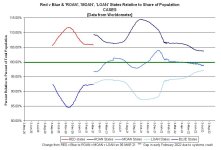
22-07-09 E3b - RvB Mortality RECENT GRAPH.JPG
 
***********************************************

BLOCK 6 – THE “BOTTOM 54”s (plus a bit)

***********************************************

Of the countries in the WORST quartile for “Total Cases”, the US, with around 8.39% of the total population of the group, has around 17.07% of the total cases for the group. This is roughly 2.03 times its proportional share and earns a “D-“.

22-07-09 F1 - WORST 54 TOTAL CASES.JPG
Of the countries in the WORST quartile for “Total Deaths”, the US, with around 8.07% of the total population of the group, has around [COLOR="RED]17.22%[/COLOR] of the total cases for the group. This is roughly [COLOR="GREEN"]2.13[/COLOR] times its proportional share and earns a “D-”.

22-07-09 F2 - WORST 54 TOTAL DEATHS.JPG
Of the countries in the WORST quartile for “Deaths per Million”, the US, with 3,122 (it was 3,115 last week), has around 2.02 times its proportional share and earns a “D+”. The US [#17] (no change from last week) is doing 0.0301% better than Brazil and just 0.2498% worse than Gibraltar.

22-07-09 F5 - WORST 54 DEATHS per MILLION.JPG
That table shows that those people who are panic mongering and claiming that the US has the world’s highest COVID-19 death rate either simply don’t know what they are talking about or are deliberately attempting to spread false information.

<SARC>Since there are 16 COUNTRIES that have a HIGHER “DEATHS per MILLION” rate than the US does, that means (according to the Florida OFFICE OF THE Former PRESIDENT OF THE UNITED STATES OF AMERICA [and its authorized representatives – ROOMS TO RENT – contact “Donnie” at 1-900-968-3658]) that the US is doing better than any other country and that that is all due to the inspired leadership of Donald John Trump {BBHN}.

As everyone knows, almost all of the countries with higher “Deaths per Million” counts than the US has have those so-called “Universal Healthcare Insurance” programs and that is definitive proof that those so-called “Universal Healthcare Insurance” programs are ineffective and result in the deaths of millions because of their reliance on Death Panels to ration healthcare (unlike the US where you get all the healthcare that you can pay for out of your own pocket [at rates determined by totally unbiased actuaries and CFOs {solely concerned with maximizing profit <AND who already have really great healthcare insurance plans as part of their employment>}]) </SARC>.​
 
***********************************************

BLOCK 7 – US States DATA and CORRELATIONS
Mortality Measurements

***********************************************

The fact that the total number of US deaths continues to rise isn’t going to surprise anyone other than Dr. Mashmont who jusknowz that the ABSOLUTE MAXIMUM number of COVID-19 deaths peaked out at 10,300 and that there hasn’t been a single COVID-19 death in the US since April 4, 2020.

The "Mashmont Theory" appears to be that the world's medical community and every other government in the world are all lying about the impact of COVID-19 on the people of the world AND that they are doing so specifically to make God, Mr. Trump, and **D*O*C*T*O*R** Mashmont (not necessarily in that order) look bad.

22-07-09 G1 - TOTAL DEATHS.JPG
Updated to the past 24 hours, the US (with approximately 4.23% of the world’s population) has had approximately 16.12% of the world’s COVID-19 cases. That is a disparity of 3.81 :: 1 (which is an “F”). It also has 16.41% of the world’s COVID-19 deaths, which is a disparity of 3.88 :: 1 (which is an “F“).

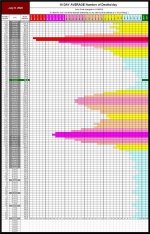
A more easily grasped illustration <SARC>(with almost all of those confusing numbers removed [and brightly colored] so that even the innumerate followers of **D*O*C*T*O*R** Mashmont can understand it) </SARC> of what the "Daily Death Rate" (using the Saturday numbers [and those since the weekly update four weeks ago] for simplicity) is doing in the US is

22-07-09 G2 - FADING OF THE GREEN TABLE.JPG
NOTE - This graphic has gotten so large that I have had to double compress the lines for 2020 and the first bit of 2021.
The US rate IS coming back down even though “Claque Failed Casino Operator” convinced a whole lot of people that they didn’t need to get vaccinated because [1] everyone else was doing is so they didn’t have to and [2] there was no reason to fear the spread of COVID-19 because everyone was getting vaccinated and it really wasn’t all that serious (if it existed at all). That increase WILL resume if "Claque Failed Casino Operator" is successful in its campaign to ensure that the current administration does not succeed in bringing the US out of the current situation (a campaign which they are waging REGARDLESS of the actual effects on the American people because the ONLY thing that "Claque Failed Casino Operator" is concerned with is ensuring that it rules America).

When you look at the WORST quartile for “Active Cases” (where the US has regained its “lead”), then the US with around 8.84% of the total population, has around 18.61% of the “Active Cases”, which is a letter grade of “D-”. <SARC>Far be it from me to even hint that the data was being withheld in order to make the American performance vis-à-vis COVID-19 look worse than it actually was so that the _[fill in the blank]_ party could gain some electoral advantages and are now doing so again in preparation for the mid-term elections. </SARC>

22-07-09 F3 - WORST 54 ACTIVE CASES.JPG
 
***********************************************

BLOCK 8 – VACCINATIONS

***********************************************

The US has given 78% of its population at least one shot and is in 8th place – with 95.12% of Japan [#4], 92.85% of Italy [#3], 89.66% of Canada [#2], and 83.87% of China [#1].

22-07-09 J1a - WORLD SINGLE DOSE.JPG
The US has completely vaccinated around 67% of its population and is in 8th place – with 83.75% of Italy [#4], 81.71% of Japan [#3], 79.76% of Canada [#2],, and 74.44% of China [#1].

22-07-09 J1b - WORLD FULL DOSE.JPG
The disparity between the US “One Shot” and “Full Shot” rates can possibly be explained by the fact that the US had a “lock” on the vaccines that only required a single dose to be effective (and would not license them for production outside of the US) while other countries were forced to rely on vaccines that required two doses for full effectiveness AND because the US concentrated on “Full Vaccination” rather than “Maximum Vaccination” – but that’s just an EWAG.

On balance, the US administrations (Federal and State) are still (considering the intransigence of some segments of the American population [and the actual efforts to sabotage it by others]) doing a pretty good job (as opposed to the “one heckuva job” they were doing prior to 20 JAN 21) but "Claque Failed Casino Operator" is still demanding that the current (illegal) so-called "administration" **D*O** **S*O*M*E*T*H*I*N*G** about this "terrible failure" (PROVIDED that that “something” doesn’t include vaccinations or quarantines or anything else that inconveniences them in the slightest).

Today’s numbers are not available at time of posting (mainly because my “legacy” software can no longer access the site fully) so you’ll just have to be satisfied with the graphic. Canada, with only 86.46% of the population over 5 years old fully vaccinated and a mere 49.13% being “boosted”, still has a way to go.

22-07-09 J2 - LAST YEARS VAX RATES - WORLD.JPG
The situation APPEARS to be that it isn't so much other countries increasing their rates of vaccination (although they are doing that as well) as it is the US (which has LOTS of vaccine and LOTS of places where you can get vaccinated) is simply running out of people who are willing to get vaccinated. The people who aren't getting vaccinated appear to be working on the assumption that they will never encounter another non-vaccinated person and so there will be no chance of them contracting COVID-19. In gambler's terms, that's like betting, repeatedly, everything you own on something where the odds are 3.5 to 1 in your favour but the payout is only 1 for 1,000,000. If you don't understand that, what it means is that you will "win" a whole lot of the time, but you only have to lose once in order to be busted.​
 
Back
Top Bottom