• We will be taking the forum down for maintenance at [3:30 PM CDT] - in 25 minutes. We should be down less than 1 hour.
  • This is a political forum that is non-biased/non-partisan and treats every person's position on topics equally. This debate forum is not aligned to any political party. In today's politics, many ideas are split between and even within all the political parties. Often we find ourselves agreeing on one platform but some topics break our mold. We are here to discuss them in a civil political debate. If this is your first visit to our political forums, be sure to check out the RULES. Registering for debate politics is necessary before posting. Register today to participate - it's free!

Daily and Weekly Statistical Summaries of COVID-19 NEW Thread

TU Curmudgeon

B.A. (Sarc), LLb. (Lex Sarcasus), PhD (Sarc.)
DP Veteran
Joined
Mar 7, 2018
Messages
62,581
Reaction score
19,334
Location
Lower Mainland of BC
Gender
Male
Political Leaning
Centrist
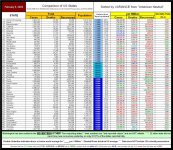
Still working on the data base, but here is an interim report.

First of all, a "G-8+China" + "World" + "Europe" (non-normalized) table.

22-02-02 A1 - G8 + CHINA COVID TABLE.JPG
Second, the US daily "progress" summary.

22-02-02 A2 - COVID vs Other Causes TABLE.JPG
And third, a "G-8+China" + "World" + "Europe" comparative ratio table.

22-02-02 A3 - Comparison of Ratios TABLE.JPG
More as they get rebuilt.

You will notice some changes because I will no longer be using 10 and 30 day averages. I'm changing those to 14 and 28 day averages because that will (mostly) eliminate the "weekend wobbles".


Is the China death rate so high because they don't test, don't report tests, or some other reason?
 
Is the China death rate so high because they don't test, don't report tests, or some other reason?
China hasn't reported a death from COVID-19 in over a year and their reported numbers for cases and recovered are totally unbelievable.

On the other hand, their reported numbers for vaccinations (data base not yet reconstructed to report on that metric) do appear to be (at least) plausible.

Because of the current short "base line" for 2022 (only 32 days), the US projected numbers of COVID-19 cases WILL be undergoing some pretty significant changes as that base line expands.

However, the projected dates for reaching the number of US deaths from COVID-19 is reasonably reliable.
 
Two places whose data I automatically dismiss: China and Florida.

The tables are fine, but they omit (to absolutely no fault of the OP) the type of data that so far only New York and Washington regularly update and report: hospitalizations and cases for vaccinated vs unvaccinated. This is the single most important kind of data that people can actually do anything with, and the fact that only two states (that I know of) are providing it is completely insane.
Don't dismiss the Chinese data on vaccinations so readily. I suspect that it is reasonably accurate (and the fact that that data makes the PRC government look good doesn't really mean that it is reluctant to release it).

As far as the Florida data is concerned, if you were only interested in analyzing the situation two weeks ago, then it's probably reasonably decent (since they would likely have stopped retroactively increasing the daily case and death numbers for days more than two weeks in the past).

Hospitalizations is a metric that I find dodgy because it's difficult (to the point of impossibility as far as I am concerned) to determine which are "hospitalized WITH Covid-19" and which are "hospitalized DUE TO Covid-19".

I admit that a "total cases"/"cases where vaccinated"/"cases where NOT vaccinated" analysis would be interesting but I think that it would have to be expanded by including "cases where infected previously but vaccinated afterwards" and "cases where infected previously but not vaccinated afterwards" (because prior infection does give some protection against reinfection) and when you take a look at the data you will find that that breakdown simply isn't available.

Anyhow, progress is being made on the data base, and I'm posting all of the tables and graphs that are working so far.
 
POSTED WITHOUT COMMENT
These are the tables and graphs that are working so far.

22-02-04 A1 - G8 + CHINA COVID TABLE.JPG
22-02-04 A2 - COVID vs Other Causes TABLE.JPG
22-02-04 A3 - Comparison of Ratios TABLE.JPG
 
Don't dismiss the Chinese data on vaccinations so readily. I suspect that it is reasonably accurate (and the fact that that data makes the PRC government look good doesn't really mean that it is reluctant to release it).

As far as the Florida data is concerned, if you were only interested in analyzing the situation two weeks ago, then it's probably reasonably decent (since they would likely have stopped retroactively increasing the daily case and death numbers for days more than two weeks in the past).

Hospitalizations is a metric that I find dodgy because it's difficult (to the point of impossibility as far as I am concerned) to determine which are "hospitalized WITH Covid-19" and which are "hospitalized DUE TO Covid-19".

I admit that a "total cases"/"cases where vaccinated"/"cases where NOT vaccinated" analysis would be interesting but I think that it would have to be expanded by including "cases where infected previously but vaccinated afterwards" and "cases where infected previously but not vaccinated afterwards" (because prior infection does give some protection against reinfection) and when you take a look at the data you will find that that breakdown simply isn't available.

Anyhow, progress is being made on the data base, and I'm posting all of the tables and graphs that are working so far.

We can reasonably accept that the data of vaccinated-vs-nonvaccinated hospitalizations are due to covid because the difference is so glaring that you'd otherwise have to conclude that unvaccinated people are just extraordinarily clumsy or unlucky.
 
We can reasonably accept that the data of vaccinated-vs-nonvaccinated hospitalizations are due to covid because the difference is so glaring that you'd otherwise have to conclude that unvaccinated people are just extraordinarily clumsy or unlucky.

Toss in "mostly" and I think that we are in accord.
 
Still slogging away at the data base. There are some major analytical changes because the US "Mortality Rate (Closed)" has become so unreliable due to the fact that 18 states (that's 35.29% when you consider the District of Columbia as a state) are NOT reporting the number of recovered cases.

However, here are today's "A List" world and US summaries

22-02-05 A1 - G8 + CHINA COVID TABLE.JPG
22-02-05 A2 - COVID vs Other Causes TABLE.JPG
22-02-05 A3 - Comparison of Ratios TABLE.JPG
And, starting on the next frame, you will find the latest versions of the "ROAN", "MOAN", "LOAN" comparison tables
 
The latest, updated, versions of the tables and graphs for US Daily Deaths (without commentary) start here

22-02-05 C1 - US 7 Day DEATH Averages - GRAPH.JPG
22-02-05 C1a - US 7 Day DEATH Averages - GRAPH (BLACK).JPG
22-02-05 C2a - US 14 Day avg of 7 d.a. GRAPH.JPG
 
22-02-05 D1e RED v BLUE MORTALITY TABLE.JPG
22-02-05 D1f - RED v BLUE ALPHABETICAL TABLE.JPG
 

Attachments

  • 22-02-05 D1g - RED v BLUE VARIANCE TABLE.JPG
    22-02-05 D1g - RED v BLUE VARIANCE TABLE.JPG
    336.6 KB · Views: 0
Still slogging away. So here are today's "Big 3"

22-02-06 A1 - G8 + CHINA COVID TABLE.JPG
22-02-06 A2 - COVID vs Other Causes TABLE.JPG
22-02-06 A3 - Comparison of Ratios TABLE.JPG
and starting with the next frame, the latest rebuilt tables and charts.

There is a data gap for the first four days of February (don't you just love it when your computer eats your files) and I have changed the US mortality rate that I am using from "Mortality Rate (Closed)" to "Mortality Rate (ALL)" due to the fact that so many of the states have ceased reporting on the number of recovered cases - which made that metric highly unreliable.​
 
Still pounding code, but here are today's "Big Three" (followed in the next frames by the latest additions)

22-02-08 A1 - G8 + CHINA COVID TABLE.JPG
22-02-08 A2 - COVID vs Other Causes TABLE.JPG
22-02-08 A3 - Comparison of Ratios TABLE.JPG
 
And here are the latest updated tables and graphs.

The "Top 25" tables have now been made uniform and changed to the "Worst Quartile".

22-02-08 E1 - INDEX (DpM div TpM).JPG
22-02-08 E2 - RvB Mortality.JPG
22-02-08 E3a - RvB Mortality GRAPH.JPG
 
Back
Top Bottom