• This is a political forum that is non-biased/non-partisan and treats every person's position on topics equally. This debate forum is not aligned to any political party. In today's politics, many ideas are split between and even within all the political parties. Often we find ourselves agreeing on one platform but some topics break our mold. We are here to discuss them in a civil political debate. If this is your first visit to our political forums, be sure to check out the RULES. Registering for debate politics is necessary before posting. Register today to participate - it's free!

Covid: USA VS EUROPE

You haven't referred to any relevant facts. You've made a specific claim and not backed it up with anything, other than generally referring me to "the data."
Well how about you refer to it for your answers then? A radical suggestion, I know...
 
Thanks for the correction.

I don’t have the temp spreadsheets I got my math from, so I don’t know where my numbers went wrong. Below is Europe as of 11/4/20:

TotalTotalTot Cases/Deaths/Population
CountryCasesDeaths1M pop1M pop
Europe
10,997,959​
279,209​
14,707​
373​
747,788,047​
Netherlands
383,523​
7,682​
22,365​
448​
Source: worldometer

And the world:

https://www.worldometers.info/coronavirus/

I don't know that Netherlands 20% higher death rate and 52% higher case rate than all of Europe is "abysmally worse", but the point remains the same. There is nothing lucky about Netherlands being so much worse compared to the Euro and world avg. Being better than the US is no feather in one’s cap, either.

I have already written to the Worldometer for incorrect data, they under count the actual population of the Netherlands

Screenshot_2020-11-06 Bevolkingsteller.png

This is the actual population according to the Dutch statistical agency, meaning more than 300,00 more people than counted by Worldometer. So our deaths per 1 million and cases per 1 million will go down a bit.
 
Well how about you refer to it for your answers then? A radical suggestion, I know...

There's nothing to refer to. It's nonsensical and has nothing to do with the claim. And even worse, there's been no attempt at an argument to connect the data to the claim.
 
You haven't referred to any relevant facts. You've made a specific claim and not backed it up with anything, other than generally referring me to "the data."

I have referred you to the at Daily Statistical Summary of COVID-19 thread where the data is posted.

That you cannot follow a link is NOT my problem.
 
I have referred you to the at Daily Statistical Summary of COVID-19 thread where the data is posted.

That you cannot follow a link is NOT my problem.

Sorry, you don't get to point to a haystack of data and put the burden on me to find the needle that supposedly supports your claim. That's not the way debate works. That's the way retreat works.
 
Thanks for the correction.

I don’t have the temp spreadsheets I got my math from, so I don’t know where my numbers went wrong. Below is Europe as of 11/4/20:

TotalTotalTot Cases/Deaths/Population
CountryCasesDeaths1M pop1M pop
Europe
10,997,959​
279,209​
14,707​
373​
747,788,047​
Netherlands
383,523​
7,682​
22,365​
448​
Source: worldometer

And the world:

https://www.worldometers.info/coronavirus/

I don't know that Netherlands 20% higher death rate and 52% higher case rate than all of Europe is "abysmally worse", but the point remains the same. There is nothing lucky about Netherlands being so much worse compared to the Euro and world avg. Being better than the US is no feather in one’s cap, either.
Or, from the same source as of today

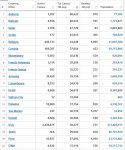
20-11-06 - Europe .JPG

20-11-06 - Europe Active Cases TOP 20.JPG

20-11-06 - Europe Cases per Million TOP 20.JPG
 
And finally

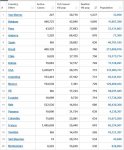
20-11-06 - Europe Total Deaths TOP 20.JPG

Which you can compare to the numbers for the US states

20-11-06 D1 - Red vs Blue - States by Color Sort TABLE.JPG
 
Sorry, you don't get to point to a haystack of data and put the burden on me to find the needle that supposedly supports your claim. That's not the way debate works. That's the way retreat works.

Yes, I guess that if you insist on deciding that you aren't going to look at the data, there isn't much I can do except

20-11-06 A1 - G8 + CHINA COVID TABLE.JPG

20-11-06 A2 - COVID vs Other Causes TABLE.JPG

20-11-06 A3 - Comparison of Ratios TABLE.JPG
spoon feed you (and, quite frankly, I'm not all that interested in what anyone who deliberately remains uninformed thinks the know the stuff that they deliberately don't know means).
 
Yes, I guess that if you insist on deciding that you aren't going to look at the data, there isn't much I can do except

spoon feed you (and, quite frankly, I'm not all that interested in what anyone who deliberately remains uninformed thinks the know the stuff that they deliberately don't know means).

Ugh. God knows how you can possibly think that this information supports your claim that there's 2-3 week lag between Europe and the US. Have fun in your fantasy bubble.
 
As one of the most densely populated countries over 10 million, we are doing fairly well. And it is stupid to compare it to countries that are not comparable in size, location and other local issues that spread covid through the Netherlands.


No you're not. Of the most densely pop countries over 10M, you're not. But that's you're claim. It's for you to prove. Show us some evidence to back up your own words or your words are worthless. Maybe define what you mean by "fairly well", and "...comparable in size, location and other local issues that spread covid through the Netherlands." You've given yourself a lot of room to make up pretty much whatever you want. But try. Then, give us some data. I did. You can't refute the facts I gave. There's nothing lucky, based on what the both of us have provided as evidence of fact, about Netherlands virus performance. The burden of proof is on you. Without which, your claim is unfounded and need not be debated further. You imply my comparison is stupid. Show us something intelligent of yours that makes Netherlands look markedly better.
 
No you're not. Of the most densely pop countries over 10M, you're not. But that's you're claim. It's for you to prove. Show us some evidence to back up your own words or your words are worthless. Maybe define what you mean by "fairly well", and "...comparable in size, location and other local issues that spread covid through the Netherlands." You've given yourself a lot of room to make up pretty much whatever you want. But try. Then, give us some data. I did. You can't refute the facts I gave. There's nothing lucky, based on what the both of us have provided as evidence of fact, about Netherlands virus performance. The burden of proof is on you. Without which, your claim is unfounded and need not be debated further. You imply my comparison is stupid. Show us something intelligent of yours that makes Netherlands look markedly better.

The best comparison of our location in the world, population identity, age distribution, wealth, density, culture is our neighbor to the south, Belgium. Belgium has a population density of 973 per squared mile and the Netherlands has 1,093 per square mile.

Belgium's death per 1 million is 1,095 and the infections are 42,046 per 1 million citizens.

The Netherlands's death per 1 million is 456 and the infections are 23,147 per 1 million citizens

Unemployment in the Netherlands is 4.4% and Belgium 6.7%
 
Ugh. God knows how you can possibly think that this information supports your claim that there's 2-3 week lag between Europe and the US. Have fun in your fantasy bubble.

You might not have noticed it, but today is the first day since 28 AUG 20 that the US "Rolling 7 Day Average" deaths has exceeded 1,000. Today is also the first time that the daily deaths in the US has exceeded 1,000 for four days in a row since 05 SEP 20.

I know that reality is sometimes painful, but it also has to be faced.

20-11-07 C1 - 7 Day Average GRAPH.JPG

20-11-07 C2 - 10 Day Average of Averages GRAPH.JPG.JPG

20-11-07 C3 - Mortality Index GRAPH.JPG.JPG
(See Daily Statistical Summary of COVID-19 for more details)​
 
The best comparison of our location in the world, population identity, age distribution, wealth, density, culture is our neighbor to the south, Belgium. Belgium has a population density of 973 per squared mile and the Netherlands has 1,093 per square mile.

Belgium's death per 1 million is 1,095 and the infections are 42,046 per 1 million citizens.

The Netherlands's death per 1 million is 456 and the infections are 23,147 per 1 million citizens

Unemployment in the Netherlands is 4.4% and Belgium 6.7%

Some how the Netherlands doesn't quite make it into the "Top 20", even though the curve does parallel the general European curve.

20-11-07 Netherlands.JPG

20-11-07 zW1 - Worldometer TOP Cases per Million TABLE.JPG

20-11-07 zW2 - Worldometer TOP Deaths per Million TABLE.JPG
Isn't it wonderful how some people whose countries are doing so much worse than the Netherlands is doing want to argue about how badly the Netherlands is doing while ignoring the record in their own country?
 
I have already written to the Worldometer for incorrect data, they under count the actual population of the Netherlands

View attachment 67303293

This is the actual population according to the Dutch statistical agency, meaning more than 300,00 more people than counted by Worldometer. So our deaths per 1 million and cases per 1 million will go down a bit.


A number of country pops are wrong both over and under, perhaps because of the pop total being taken back in the early part of the yr vs updates since. Worldometer should update all their pops. Still, it doesn't change the point of my post. Nothing lucky about Netherland virus death and case totals.
 
The best comparison of our location in the world, population identity, age distribution, wealth, density, culture is our neighbor to the south, Belgium. Belgium has a population density of 973 per squared mile and the Netherlands has 1,093 per square mile.

Belgium's death per 1 million is 1,095 and the infections are 42,046 per 1 million citizens.

The Netherlands's death per 1 million is 456 and the infections are 23,147 per 1 million citizens

Unemployment in the Netherlands is 4.4% and Belgium 6.7%


So, your basing your being “lucky” by comparing yourself to one, single nation. Yeah, right.

Your longest border is with Germany, which country is densely populated and has much better stats than Netherlands.

The virus doesn’t follow your criteria. There’s nothing “lucky” about your death and case counts/million pop.

You might find the following interesting when considering how "lucky" a country is

20-11-10 C2 - 10 Day Average of Averages GRAPH.JPG

20-11-10 C3 - Mortality Index GRAPH.JPG.JPG

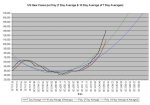
20-11-10 B4 - Daily New Case Averages.JPG
 
So, your basing your being “lucky” by comparing yourself to one, single nation. Yeah, right.

Your longest border is with Germany, which country is densely populated and has much better stats than Netherlands.

The virus doesn’t follow your criteria. There’s nothing “lucky” about your death and case counts/million pop.

So you think 603 people per square mile is as densely populated with a country that has 1,063 per square mile? Yeah, I think it is not that similar. And did other countries do it better, YUP, but this is an thread about comparing the US to Europe. And Germany as you say does it even much much better than most other big countries.
 
So you think 603 people per square mile is as densely populated with a country that has 1,063 per square mile? Yeah, I think it is not that similar. And did other countries do it better, YUP, but this is an thread about comparing the US to Europe. And Germany as you say does it even much much better than most other big countries.

I rather suspect that there would be some interesting correlations if you were able to divide each country up into one acre (0.404686 hectare) packages and then compare those packages with respect to population density, infection rate, and death rate.

I sort of expect that the correlation between an European package and an American package with the same population density would be fairly close with respect to infection rate.

PS - It does appear that the evidence is in and that "Europe" IS in the midst of a "Second Wave"

20-11-11 A3 - Comparison of Ratios TABLE.JPG
20-11-11 B3 - Our World in Data CDC G-8 plus China GRAPH.JPG

however, it also appears that the stats for "Europe" are being dragged down rather seriously by France, Italy, and the UK.
 
You might find the following interesting when considering how "lucky" a country is


Those down trend lines prove that TRUMP BANNING CHINA TRAVEL in January prevented mortality worsening and saved lives while the mortality, testing, cases graph proves Trump not bothering with tests and those silly, unmanly masks did not matter as herd immunity gradually kicked-in and the younger people showed how resilient they were to the virus. The genius of Trump’s one and only virus action taken so far of banning china travel did it all. Eat your heart out, spiten-Biden!
 
Those down trend lines prove that TRUMP BANNING CHINA TRAVEL in January prevented mortality worsening and saved lives ...

Except, of course, he didn't actually "ban" travel from China, did he? He allowed tens of thousands of people to travel from China to the US (they happened to be US citizens and/or legal residents).

...while the mortality, testing, cases graph proves Trump not bothering with tests and those silly, unmanly masks did not matter as herd immunity gradually kicked-in...

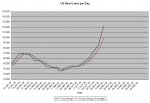
Quite right, and it is all of that unconstitutional testing and those "silly, unmanly, masks" that produced this officially certified White House graph that shows how successful Mr. Trump was


and anyone who pays attention to this lying, left-wing, liberal, socialist, commie, pinko, red lying graph

20-11-13 B4 - Daily New Case Averages.JPG
(More charts and graphs at Daily Statistical Summary of COVID-19)​

is a lying, left-wing, liberal, socialist, commie, pinko, red and should be kept isolated from all patriotic, right-thinking, patriotic, hard working, patriotic, honest, patriotic, real, patriotic, true, patriotic, conservative, patriotic, Christian, patriotic, White, patriotic, American, patriotic, patriots.

... and the younger people showed how resilient they were to the virus.

Generally speaking the usual course of events is that the younger a person is, the less likely they are to have one of the known co-morbidities for COVID-19.

The genius of Trump’s one and only virus action taken so far of banning china travel did it all. Eat your heart out, spiten-Biden!

Actually I do recognize that your whole post was

00-00-03 - Tongue in Cheek.jpg
(Sorry, but that was the best that I could find.)​
 
So you think 603 people per square mile is as densely populated with a country that has 1,063 per square mile? Yeah, I think it is not that similar. And did other countries do it better, YUP, but this is an thread about comparing the US to Europe. And Germany as you say does it even much much better than most other big countries.


Your claim was “As one of the most densely populated countries over 10 million, we are doing fairly well.” with the qualification that Netherlands not be compared “… to countries that are not comparable in size, location and other local issues that spread covid through the Netherlands” and the most recent added qualification being that the comparison be to Belgium and Belgium only.

In which case it doesn’t matter where you stand compared to all of the world, or compared to Europe, or compared to developed nation or compared to most densely pop countries. I wish my teachers through grade school and college graded like you on a curve compared to the one worst performing single student (country) in the whole class (local geographic area of similar density).

Y’all stretch for such high standards. The thickness of the bar laying on the ground.

How much better than the US would a country have to be doing before you would concede that they are "doing fairly well"?

20-11-14 A1 - G8 + CHINA COVID TABLE.JPG
(More charts and graphs at Daily Statistical Summary of COVID-19)​
 
Today + 95000 infections in USA, Total of population 329.000.000

+ 136000 infections in France + Spain + UK + Italy + Germany, Total of population 320.000.000

So the covid situation is better in USA than Europe.

It is false to say bad in USA the gestion of Covid.

Don't mix PCR-positive tests with true infections.
PCR is a phony test which is according WHO, Dr Fauci and NYT in the most of cases wrong.
PCR 'tests' can show you a 1,000,000 new positive cases daily, it depends just on political decisions
 
Except, of course, he didn't actually "ban" travel from China, did he? He allowed tens of thousands of people to travel from China to the US (they happened to be US citizens and/or legal residents).


Quite right, and it is all of that unconstitutional testing and those "silly, unmanly, masks" that produced this officially certified White House graph that shows how successful Mr. Trump was


and anyone who pays attention to this lying, left-wing, liberal, socialist, commie, pinko, red lying graph


is a lying, left-wing, liberal, socialist, commie, pinko, red and should be kept isolated from all patriotic, right-thinking, patriotic, hard working, patriotic, honest, patriotic, real, patriotic, true, patriotic, conservative, patriotic, Christian, patriotic, White, patriotic, American, patriotic, patriots.


Generally speaking the usual course of events is that the younger a person is, the less likely they are to have one of the known co-morbidities for COVID-19.


Actually I do recognize that your whole post was

View attachment 67304639
(Sorry, but that was the best that I could find.)​


Now that's talking out of your ass. If that's the best you can do, no need to be sorry. Spot-on.

Looks like the hand on the Sharpie drawing that graph was a bit shaky.
 
Back
Top Bottom