• This is a political forum that is non-biased/non-partisan and treats every person's position on topics equally. This debate forum is not aligned to any political party. In today's politics, many ideas are split between and even within all the political parties. Often we find ourselves agreeing on one platform but some topics break our mold. We are here to discuss them in a civil political debate. If this is your first visit to our political forums, be sure to check out the RULES. Registering for debate politics is necessary before posting. Register today to participate - it's free!

Coral Reef recovering rapidly

If you don’t understand how climate works, it’s probably better to shut up and listen to the people who actually do understand.

More hand waving from you, the guy who doesn't understand what a La Nina is....
 
Where in the source does it say that La Nina causes a cooling effect on the barrier reef? You argued that the recovery was due to La Nina, while they clearly argue that the bleaching occurred during a La Nina....


That doesn't say what you think it says. :rolleyes:

"A few acute stresses" is doing all the leg work in that statement, and the rest of it does not claim that La Nina cools the waters in the GBR.

And, and in fact, La Nina is specifically an accumulation of warm eastern Pacific waters in the Western Pacific.

And in fact NOAA shows the waters around the GBR are warmer than normal, and clearly shows the La Nina pushing warm water into the region.

View attachment 67405539
I think you might be geographically challenged. The waters around the GBR sure look kinda blue to me, except in the South…where the bleaching isn’t recovering as well.
 
I think you might be geographically challenged. The waters around the GBR sure look kinda blue to me, except in the South…where the bleaching isn’t recovering as well.

No, I'm not the one who is geographically challenged.

Great Barrier Reef Map:

1659975760759.png

NOAA map, again:

1659975922156.png

So please point out where you are seeing blue around the GBR?

In fact the blue starts almost precisely where the GBR stops.
 
Last edited:
Also worth noting, as further evidence of the La Nina warming effect on the waters off of Australia: A La Nina during the Australian winter brings heavy rains to Australia.

The excessive rain happens because the warmer oceans generate more water vapor in the atmosphere, which then moves over the colder mainland and condenses to rain. It's much the same process that produces lake effect snows in states bordering the great lakes..

And yes, Australia has been hammered by heavy rains this year because of La Nina.
 

Are you blind? Your own video shows that the entire region of the Great Barrier reef remains warmer than usual.

Here, I've marked roughly where the Great Barrier Reef is located since you apparently didn't glean that from the last map I posted that shows specifically where the Great Barrier reef is located.:

1659977878426.png
 
Are you blind? Your own video shows that the entire region of the Great Barrier reef remains warmer than usual.

Here, I've marked roughly where the Great Barrier Reef is located since you apparently didn't glean that from the last map I posted that shows specifically where the Great Barrier reef is located.:

View attachment 67405558
Yes, on May 10th it was slightly warmer.

But the 90 day animation I linked showed a significant period of colder temps. And, the text explaining the recovery I posted specifically stated there were less warm events then in previous years. The summer is when you get temp spikes - February or so.
 

Two Thirds of the Coral Reef are at record high coral cover. That's great news!

Region with lower coral cover largely attributed to Crown-of-Thorns Starfish infestation.


View attachment 67405469
Crown of thorn starfish are nasty! Poisonous as hell, we were instructed to not touch them. Also, you have to physically remove them from the reef, if you cut them up, you make it worse, as each arm of the starfish can re-generate into a whole new starfish. I've seen the path of destruction they leave on the reef, dove several spots down there.....

Good news!
 
Yes, on May 10th it was slightly warmer.

But the 90 day animation I linked showed a significant period of colder temps. And, the text explaining the recovery I posted specifically stated there were less warm events then in previous years. The summer is when you get temp spikes - February or so.
No it does not.
 
No it does not.
umm Does too! ?

The concept here is 'not as hot as it was when there was major bleaching events', anyway. Not sure what heat percentage over the historical mean tells you anyway - unless you're trying to point out that with global warming, all recent temperatrues are generally above the historical mean.
 
The issue addressed by Longview is that a scientist was fired for being correct because he didn't adopt the consensus position on GBR bleaching.

Saying that "well, it was still anthropogenic." doesn't address the real concern of gatekeeping in science to suit the consensus position.
climatedenier.webp
 
The issue addressed by Longview is that a scientist was fired for being correct because he didn't adopt the consensus position on GBR bleaching.

Saying that "well, it was still anthropogenic." doesn't address the real concern of gatekeeping in science to suit the consensus position.
Everything considered science is the consensus position of the experts working in that field. If you feel that’s not true in even one field, name it.

All scientific articles have to go through that consensus gatekeeping process to even be published. It’s called the peer review process.
 
umm Does too! ?

The concept here is 'not as hot as it was when there was major bleaching events', anyway. Not sure what heat percentage over the historical mean tells you anyway - unless you're trying to point out that with global warming, all recent temperatrues are generally above the historical mean.

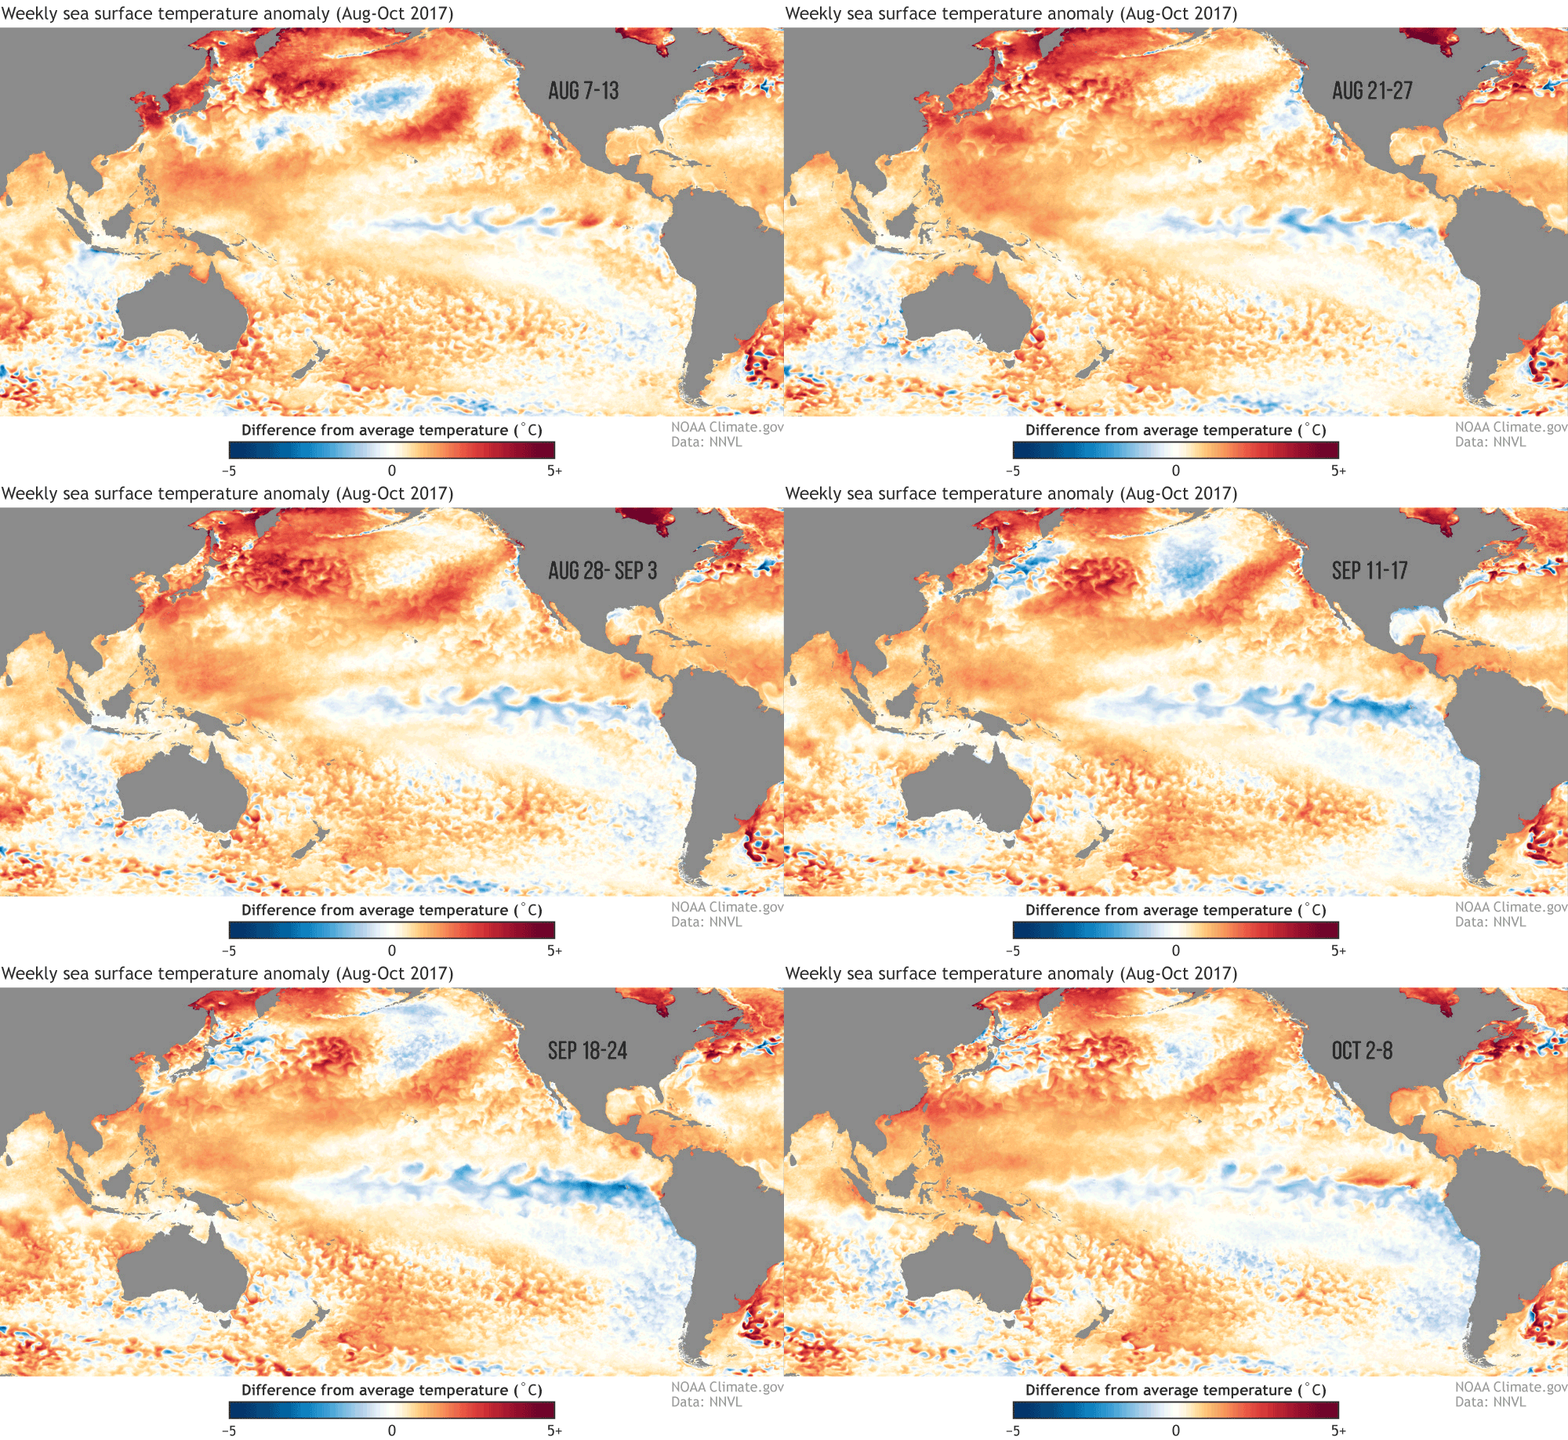
Funny enough, during the largest period of bleaching (2014-2017) the predominant ENSO pattern was El Nino which persisted from 2014 through 2016. Now, since you didn't know what La Nina was until today, let me point out that El Nino patterns are what you used to think La Nina patterns were, resulting in warm Eastern Pacific waters off the coast of North and South America, and colder water in the Western Pacific, including the GBR.

Now, 2017 was actually a La Nina year, so you might think that that year was marked by high temps in the region of the GBR, but oddly, that year resulted pretty mixed climate in the GBR region, where at times the warming was closer to what we see this year, while at other points the was marked cooling:

ENSO_Fig3_SSTA_animation_201710_large.gif


Also, it's absolutely hillarious seeing a global climate catastrophist saying this:

"Not sure what heat percentage over the historical mean tells you anyway"

... :rolleyes: You love shooting holes in your own arguments.
 

Attachments

  • 1660003432499.webp
    1660003432499.webp
    35.5 KB · Views: 0
Funny enough, during the largest period of bleaching (2014-2017) the predominant ENSO pattern was El Nino which persisted from 2014 through 2016. Now, since you didn't know what La Nina was until today, let me point out that El Nino patterns are what you used to think La Nina patterns were, resulting in warm Eastern Pacific waters off the coast of North and South America, and colder water in the Western Pacific, including the GBR.

Now, 2017 was actually a La Nina year, so you might think that that year was marked by high temps in the region of the GBR, but oddly, that year resulted pretty mixed climate in the GBR region, where at times the warming was closer to what we see this year, while at other points the was marked cooling:

ENSO_Fig3_SSTA_animation_201710_large.gif


Also, it's absolutely hillarious seeing a global climate catastrophist saying this:

"Not sure what heat percentage over the historical mean tells you anyway"

... :rolleyes: You love shooting holes in your own arguments.
How would you know what the warming is this year? All you posted was from a day in may and a day in August.
 
How would you know what the warming is this year? All you posted was from a day in may and a day in August.

You have attempted to disprove my argument regarding 2022 warming in the GBR region and all you have done if provide more evidence that I am correct.

But do go on, guy who tried to use global average temperature to explain regional ecosystem events, and who didn't know until today how La Nina effects the Western Pacific...
So what has been the water temp on the GBR this year compared with recent years?

It should be a simple question.
 
Are you saying that the AIMS study is lying? :unsure:

Edit: And if they aren't lying, then we'd have to assume that the rebounding happened entirely during May-August 2022 when the oceans around the GBR were much warmer than usual....
No, after years of reading "Oh My God The Great Barrier Reef is Dying" headlines,
juxtapositioned with "Great Barrier Reef Never Better" from your original post . . .
Anyway Gilda Radner's Emily Litella and "Nevermind!" seemed appropriate.
 
I think we can all agree that the reef doing better is a good thing!
 
So what has been the water temp on the GBR this year compared with recent years?

It should be a simple question.

It's not so simple unless someone has compiled the data for your specific requested temporal and geographical set. I'd need to compile the ERDDAP dataset across the rough rectangular bounds of the GBR (Eyeballing about -13°x139° and -20°x142° ... ish, but that would result in a rather large csv... and it amounts to doing your work for you. But it would likely be a lot of effort on your part to show that the temperature anomaly over the short term is considerably less than 1°C, and eyeballing from the 90 day anomaly graph would be about 1.6°C over baseline, but then you just argued that baseline anomalies are of little value. I would assume that isn't a hard and fast rule for you, though, since AGW is based on measured temperature anomalies versus arbitrarily selected temporal baselines...)

So if you want to show that the GBR is colder today than in previous years then by all means do so. What you have provided at this point doesn't show that.

Moreover, if the observed bleaching over previous years was a catastrophic as has been described (ie. widespread death of coral), this rebound should not be happening. There is no way for a reef as large as the GBR to expand this quickly by reproduction alone. It would appear that the bleach zones weren't nearly as dead as had been previously assumed.
Ok. Since you don’t know, I’m going to go with the people who DO know- which is what I originally posted.

Less heat stress means lower temperatures, unless it means something else in your world.
  • The combination of few acute stresses and lower accumulated heat stress in 2020 and 2022 compared to 2016 and 2017 has resulted in low coral mortality and has allowed coral cover to continue to increase in the Northern and Central GBR.
 
The cited report states:

The prognosis for the future disturbance regime suggests increasing and longer-lasting marine heatwaves, as well as the ongoing risk of outbreaks of crown-of-thorns starfish and tropical cyclones. Therefore, while the observed recovery offers good news for the overall state of the GBR, there is increasing concern for its ability to maintain this state.
 
If the great barrier reef is recovering, perhaps we should ask if anyone predicted that the reef would recover.
The extraordinary resilience of Great Barrier Reef corals, and problems with policy science
Despite this apparently plausible hypothesis, it will be argued in this chapter that there is perhaps no ecosystem on Earth better able to cope with rising temperatures than the Great Barrier Reef. Irrespective of one's views about the role of carbon dioxide (CO₂) in warming the climate, it is remarkable that the Great Barrier Reef has become the ecosystem, more than almost all others, that isused to illustrate and claim environmental disaster from the modest warming we have seen over the course of the last century.
 
Back
Top Bottom