• This is a political forum that is non-biased/non-partisan and treats every person's position on topics equally. This debate forum is not aligned to any political party. In today's politics, many ideas are split between and even within all the political parties. Often we find ourselves agreeing on one platform but some topics break our mold. We are here to discuss them in a civil political debate. If this is your first visit to our political forums, be sure to check out the RULES. Registering for debate politics is necessary before posting. Register today to participate - it's free!

World Likely has Hottest Summer on Record

I do know this. Why do you constantly harass people about topics you clearly don't understand?

Prove me wrong.

No one is harassing. Please quit lying.
And it is not for me to prove you wrong, it is for you to show the actual evidence for your claim. You have repeatedly made this claim, but you have yet to provide an iota of actual evidence to support it.
 
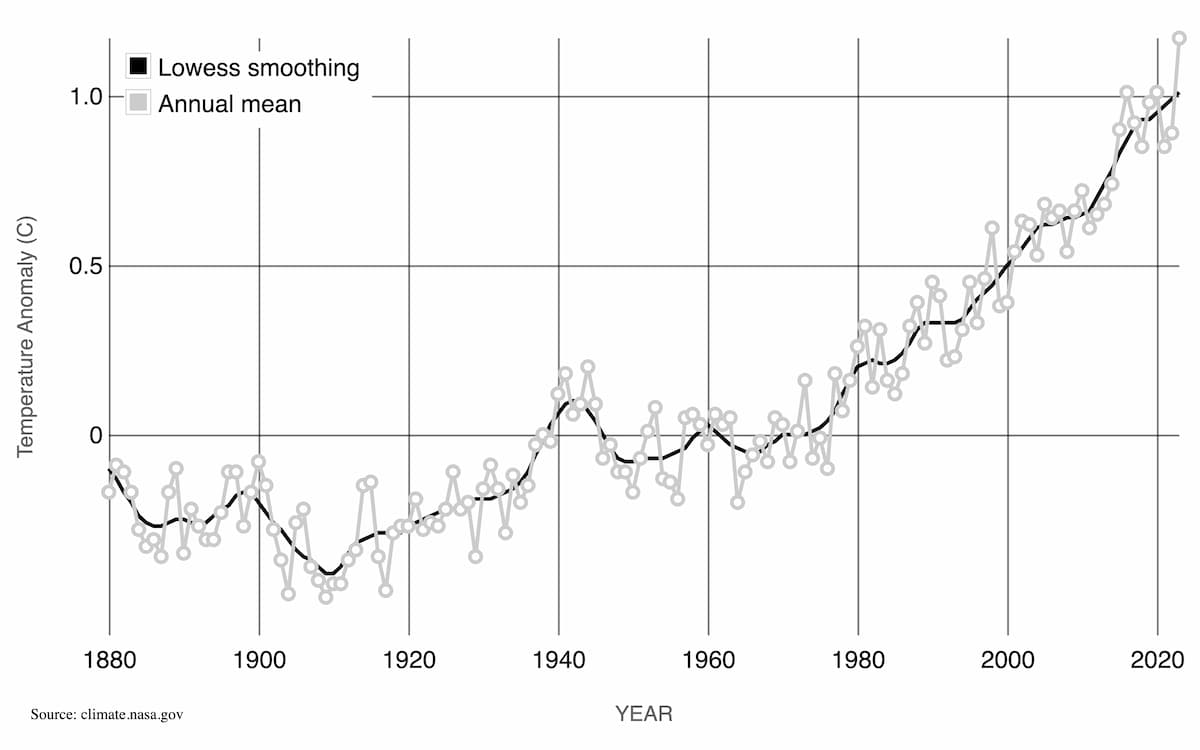
One would expect trends to show variations around the regression line (some cold years), but this seems relentless and is very concerning.

There are still for example colder La Nina years, but things are already so severe that those "colder" years are among the warmest on record. That as you said the warming is both very relentless and concerning.

GlobalTemp.webp

 
You know if you ignore the cause and ignore the politics

It's getting hotter. We all know it. No sense denying it.

Ice is melting. The seas are rising. Drought, wildfires and extreme weather is happening.

Nothing will be done about it. You as an individual just better prepare for what is to come.

There are many examples of that a transition away from fossil fuels is possible. Like for example that are rapid increase in electricity from renewable sources in the EU.

"Electricity generated from coal collapsed by 23% and gas fell by 13%, compared with the same period a year earlier.

At the same time, solar generation increased by 13% and wind power output by 5%.

This allowed 17 EU countries to generate record shares of power from renewables. Greece and Romania both passed 50% renewables for the first time, while Denmark and Portugal both surpassed 75% renewables."


One out of five cars on the road are also fully electric in Norway.


While it also are many positive examples of how investment into public transport, walking and cycling can create better cities.


A transition away from fossil fuels have also leads to massive health benefits from the reduction of toxic air pollution. While also reducing the massive costs and risks of being dependent on fuels from ruthless dictators.

 
The proxy records have really bad time resolution, one 3 moth period would be meaningless.
One of the most quoted studies of proxy temperature records is,
Marcott et al 2013
Here is what they say about the resolution.

A medium resolution of 120 years, now consider what a 3 month spike looks like with a 120 years resolution?

We know a LOT about CO2 energy state in a lab, but have no way to measure how sensitive the climate is to added CO2.
They can get much better resolution than 120 years. It is considered low-resolution proxy data when the data covers decades or centuries. However, high-resolution proxy data when the data covers approximately one year. The ice-core samples taken from Antarctica, for example, are considered to be high resolution proxy data of one year ± two months.

Granted, a three month temperature spike is still going to be smoothed out over that one year period, but it is considerably better than using low-resolution proxy data that may cover multiple decades. Furthermore, that proxy data can be supplemented by other proxy sources that help narrow down the resolution.

There is no possible way we can get daily temperatures based on any proxy data that is being collected to date. NASA GISS data is already missing months worth of data prior to the 1930s, and no data at all above 48°N latitude prior to 1915. They had no choice but to stop around 1880 because there wasn't enough observed data. It also explains why NASA GISS data has a very high uncertainty level prior to 1930 that diminishes over time as our data collection improved.

Source:
High-resolution ice cores from US ITASE (West Antarctica): development and validation of chronologies and determination of precision and accuracy - Annals of Glaciology, Volume 41, pp. 77-84 2005 (open access)
 
Those are high DAILY records, not overall climate data. Climate info on temperature is available from many sources including tree rings, glacier core samples, storm records (including from ships lost at sea), grain harvests, the geologic record, and likely from the fossil record. I am not a climate expert but I do not think your approach is correct.


If that map is wrong then by all means illustrate that ?

I'll take it over opinion and hearsay every time :)
 
I think in this case the record, is the instrumental record, which go back to between 1850 and 1880,
NASA seems to think the data before 1880 is not robust enough to qualify.

Probably true given the rudimentary nature of its collation (and the crude measurements with primitive equipment as a consequence) before that time
 
A transition away from fossil fuels have also leads to massive health benefits from the reduction of toxic air pollution. While also reducing the massive costs and risks of being dependent on fuels from ruthless dictators.
I dont see how making people colder poorer and hungrier by vastly increasing their energy costs will have any kind 'massive health benefit'.

The third world will use cheap fossil fuels whether we want them to or not given that historically their use has increased life expectancy by around three decades in the developed world.

Alleviating their poverty in a cost effective way far outweighs the concerns for the faux eco sensibilities of the western elites who would in reality rather see them die ..... Agenda 21 and all that ;)

It is ironic that tens of millions of lives could be saved every year (using just a tiny fraction of the trillions spent annually on AGW) by providing clean drinking water to the third world. These lives could be saved in the here and now ..... not in some hypothetical shonky climate model in 100 years time if the political will was really there to save human lives of course :(
 
Last edited:
And none of them are accurate except the direct measurements. As for the direct observed readings, they are too close to land use changes to represent the real global temperture and changes.
I am sure every method of measurement has a degree of uncertainty.
Many people have difficulty understanding science or scientific inquiry and unreasonably expect absolute precision.
 
They can get much better resolution than 120 years. It is considered low-resolution proxy data when the data covers decades or centuries. However, high-resolution proxy data when the data covers approximately one year. The ice-core samples taken from Antarctica, for example, are considered to be high resolution proxy data of one year ± two months.

Granted, a three month temperature spike is still going to be smoothed out over that one year period, but it is considerably better than using low-resolution proxy data that may cover multiple decades. Furthermore, that proxy data can be supplemented by other proxy sources that help narrow down the resolution.

There is no possible way we can get daily temperatures based on any proxy data that is being collected to date. NASA GISS data is already missing months worth of data prior to the 1930s, and no data at all above 48°N latitude prior to 1915. They had no choice but to stop around 1880 because there wasn't enough observed data. It also explains why NASA GISS data has a very high uncertainty level prior to 1930 that diminishes over time as our data collection improved.

Source:
High-resolution ice cores from US ITASE (West Antarctica): development and validation of chronologies and determination of precision and accuracy - Annals of Glaciology, Volume 41, pp. 77-84 2005 (open access)
Would you conclude that the melting recession of glaciers represents a warming condition for the planet? If not, how do you explain those changes?
 
If that map is wrong then by all means illustrate that ?

I'll take it over opinion and hearsay every time :)
Do you understand that a single high temperature in a region will not automatically reflect monthly or yearly heat burden in that region?
 
Probably true given the rudimentary nature of its collation (and the crude measurements with primitive equipment as a consequence) before that time
Are you familiar with Zooniverse? They have been doing a lot of the grunt work for scientists since the 1990s using everyday people. It has paid off as well, discovering well over 500 exoplanets between 1995 and 2011, and even a new type of galaxy.

One of those Zooniverse projects include searching through old English and American shipping logs for temperature data. The British Navy and American whaling ships have some of the oldest observed temperature data available, dating back to the 17th century.

Computers are not very good at reading cursive script, which is where the human volunteer comes in. I have been a Zooniverse member since 1996.

 
Would you conclude that the melting recession of glaciers represents a warming condition for the planet? If not, how do you explain those changes?
I would conclude from the overwhelming majority of receding glaciers that Earth was experiencing a brief interglacial period. Based on the evidence, the Holocene Interglacial period began around 15,000 years ago, got interrupted 13,000 years ago and slipped back into a short period of glaciation, and than began warming again 11,700 years ago after the Younger Dryas ended.

The planet has been warming ever since, with the hottest temperatures occurring between 9,000 and 5,000 years ago. Also known as the Holocene Climatic Optimum, when mean surface temperatures were between 2°C and 3°C warmer than they are today. Then the climate began fluctuating between warm and cold periods. Giving us the Minoan, Roman, Medieval, and Modern warming periods.

The problem is that these warm periods are not as warm as the prior warm period, or as long. While the cold periods that fall between these warm periods (like the Little Ice-Age from 1250 until 1850) are getting longer and colder. The current Modern warming period that began in 1850 will not last. It is what follows this warm period that should concern you.

Holocene Interglacial.png
 
Last edited:
Do you understand that a single high temperature in a region will not automatically reflect monthly or yearly heat burden in that region?

So where did these |state record temperatures come from then and why havent they been broken in many decades ? Seems rather odd that the great bulk of them fall before 1960

You are just wriggling ;)
 
If that map is wrong then by all means illustrate that ?

I'll take it over opinion and hearsay every time :)

You didn't respond to the post, per se. What are you so afraid of?
 
It's now officially the warmest o record in the northern Hemisphere at least.

Given the short duration of the instrumental record keeping and the agenda driven political massaging of it I'd say that statement is pretty meaningless :(
 
I would conclude from the overwhelming majority of receding glaciers that Earth was experiencing a brief interglacial period. Based on the evidence, the Holocene Interglacial period began around 15,000 years ago, got interrupted 13,000 years ago and slipped back into a short period of glaciation, and than began warming again 11,700 years ago after the Younger Dryas ended.

The planet has been warming ever since, with the hottest temperatures occurring between 9,000 and 5,000 years ago. Also known as the Holocene Climatic Optimum, when mean surface temperatures were between 2°C and 3°C warmer than they are today. Then the climate began fluctuating between warm and cold periods. Giving us the Minoan, Roman, Medieval, and Modern warming periods.

The problem is that these warm periods are not as warm as the prior warm period, or as long. While the cold periods that fall between these warm periods (like the Little Ice-Age from 1250 until 1850) are getting longer and colder. The current Modern warming period that began in 1850 will not last. It is what follows this warm period that should concern you.

View attachment 67466735
Chart from where?
Looks fabricated. Why aren't we well into the "projected mini ice age"?
Where do Milankovitch Cycles or sun spot activity fit into this scheme?
 
So where did these |state record temperatures come from then and why havent they been broken in many decades ? Seems rather odd that the great bulk of them fall before 1960

You are just wriggling ;)
They came for single day readings over decades. They are not records of sustained high temperatures.
 
They came for single day readings over decades. They are not records of sustained high temperatures.

Yes and no 'single day' has broken those state records ever since otherwise they wouldnt still be state records would they ? Good grief they werent just set on some randomly chosen days that ignored all others ! :rolleyes:

Prove otherwise ? ;)
 
Last edited:
  • Like
Reactions: PoS
Yes and no 'single day' has broken those state records ever since otherwise they wouldnt still be state records would they ? Good grief they werent just set on some randomly chosen days that ignored all others ! :rolleyes:

Prove otherwise ? ;)
A peak temperature on a single day during a single month in a specific year says nothing about the overall temperatures during that month.
 
A peak temperature on a single day during a single month in a specific year says nothing about the overall temperatures during that month.

Have you any proof that the 'overall' US temperatures were somehow less than todays before 1960, because if you dont then those records stand ?

You have no proof other than your own biased assertions so stop digging.

You lost so just take the hit bud :LOL:
 
  • Like
Reactions: PoS
Have you any proof that the 'overall' US temperatures were somehow less than todays before 1960, because if you dont then those records stand ?

You have no proof other than your own biased assertions so stop digging.

You lost so just take the hit bud :LOL:
We could look at what the EPA has to say, of course they are all part of the grand Deep State conspiracy intended to steal our precious bodily fluids:

 
Back
Top Bottom