Your link may not be utterly biased and filled with lies, but it certainly seems to be.
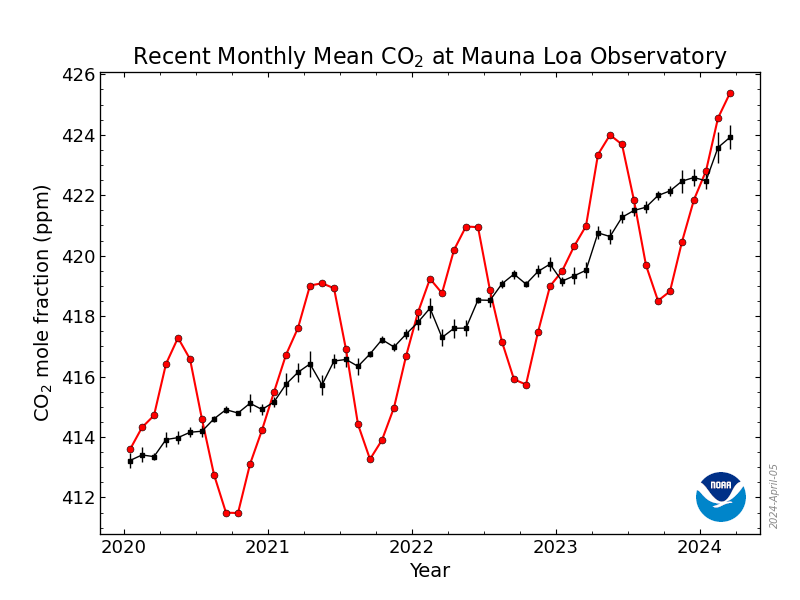
I find it very interesting now, as I did in about May or June, that even though Anthropogenic Emissions fell to about nothing for three months that the Global CO2 concentration continued to rise at about the same pace as previous years.
The rest of 2020, the Anthropogenic emissions were vastly reduced.
Buying into the AGW Alarmist CRAP gets more and more difficult with more and more data to look at.
More interesting than any other bit of data here is that the CO2 level in 2020 is about 10 points higher than 2016, but the temperature is predicted to be the same.
Does this show causality or correlation or neither?
GML conducts research on greenhouse gas and carbon cycle feedbacks, changes in aerosols, and surface radiation, and recovery of stratospheric ozone.
www.esrl.noaa.gov
<snip>
Monthly Average Mauna Loa CO2
| November 2020: | 412.89 ppm |
| November 2019: | 410.25 ppm |
Last updated: December 8, 2020
PNG Version PDF Version
PNG Version PDF Version
The graphs show monthly mean carbon dioxide measured at Mauna Loa Observatory, Hawaii. The carbon dioxide data on Mauna Loa constitute the longest record of direct measurements of CO2 in the atmosphere. They were started by C. David Keeling of the Scripps Institution of Oceanography in March of 1958 at a facility of the National Oceanic and Atmospheric Administration
[Keeling, 1976]. NOAA started its own CO2 measurements in May of 1974, and they have run in parallel with those made by Scripps since then
[Thoning, 1989].
<snip>
 yaleclimateconnections.org


