- Joined
- Feb 24, 2014
- Messages
- 33,957
- Reaction score
- 26,655
- Location
- Oceania
- Gender
- Male
- Political Leaning
- Libertarian
Because.....?
See post #147 for more info.

Because.....?
See post #147 for more info.


Ah. Because of your feewings.
Ive stated facts- feel free to refute them... if you dare.
A quack who falsely claims he won the Nobel prize and lost a libel case is not to be believed.
As a reminder: There's no correlation between GRCs and global temperatures, and the vast majority of experiments show that GCRs don't do much to seed clouds. Quaestio pointed to published articles which established that earlier in this thread (#29 etc). But it's obvious even on a fairly rudimentary level.
For those who refuse to understand what the charts below are saying: GCR counts rise and fall in roughly 11 year cycles (ring any bells?), and yet we don't see global temperatures following any sort of 11 year cycles. Hmmmmm
Plus, GCR counts trended down at a rapid clip from 1814 to 1849, and at a slower pace from 1914 to 2000; in contrast, temperatures fell from 1800 to 1847, and rose rapidly from 1917 to 2000. Hmmmmm
Plus, our denier friends often like to proclaim "no warming since 1999!!!" (because they cherry-pick, and that year had a strong El Nino effect). And yet, there is nothing unusual about GCR counts in that period -- as the lowest GCR count around that time was in 1991, and the 1997 was the same as in 1987, 1976, 1967 etc. Hmmmmm
Unsurprisingly, the correlation coefficient for GCR counts and global temperatures is -0.536. Hmmmmm
As to TSI? Guess what? No, guess! Okay, I'll tell you. TSI and GCRs are negatively correlated -- 0.79 -- and yes, there is a causal relationship there. So much for "TSI is not important." Well, yeah, it is important, it is relevant, and variations in TSI/GCRs do not explain variations in global temperatures. Hmmmmm
 [/FONT]
"Up to date?" You mean, I'm supposed to unthinkingly accept the claims from his widely ignored 2008 paper? lolThose are obsolete claims. Let me bring you up to date.


"Up to date?" You mean, I'm supposed to unthinkingly accept the claims from his widely ignored 2008 paper? lol
Did you actually read what he's saying? He's claiming that the rate of changes in a whopping 24 tidal gauges is a valid proxy for global temperatures, because he claims those station's measures correlate to TSI. No one "refuted" the paper, because it was kind of ridiculous. That's because no other measure -- including your beloved UAH -- shows any sort of 11-year pattern, as we would expect if he was right. (Correlation coefficients for direct UAH and TSI is -0.2; for UAH rate of change and TSI is -0.04.)
And what about satellite sea level measurements? Surprise! No 11-year cycles there either. Y'know, you would think that if tidal gauges are a reliable measure, then we'd see at least some type of 11-year pattern there, but no.
His claims do not pass a basic sanity check. I'm gonna go out on a limb and say that's why no one bothered to pay attention to it. Well, no one who is interested in actual climate science.
So, your defense against the charge of obsolete thinking is to parade your ignorance further? As you wish. From #157:
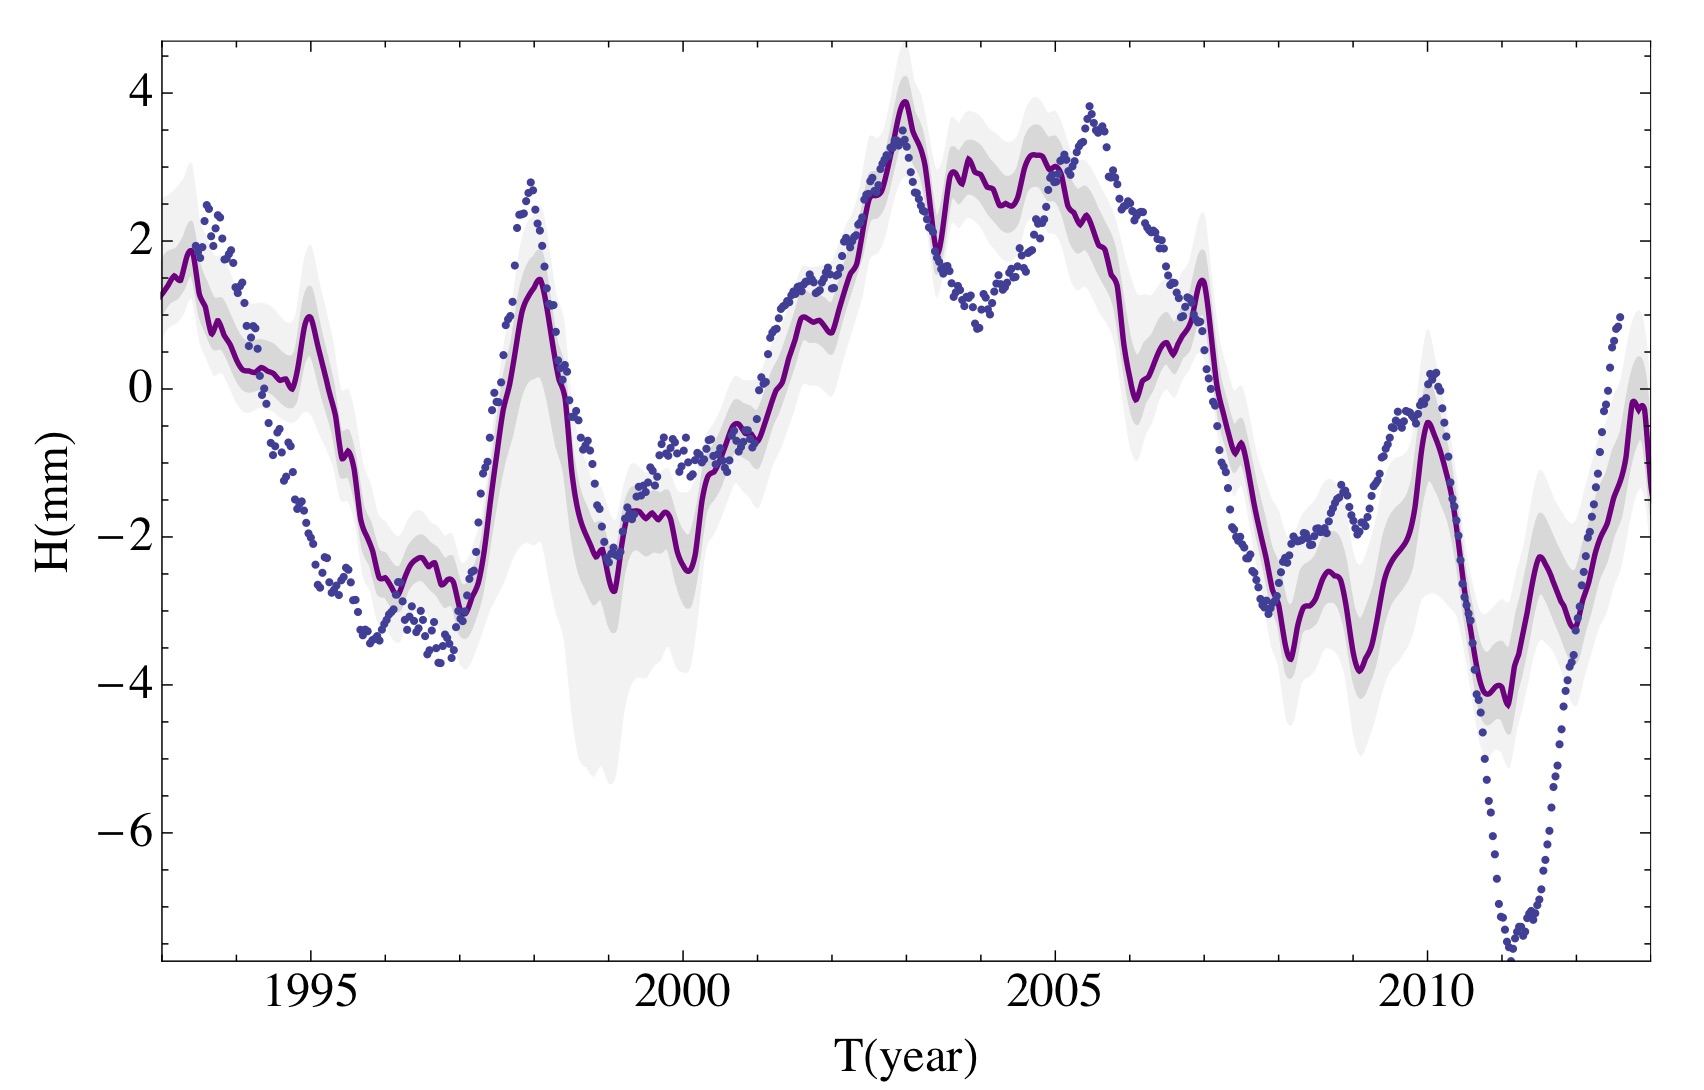
. . . As you can see, there is a very clear correlation between solar activity and the rate of change of the sea level. On short time scales most of the sea level change is due to changes in the heat going into the oceans, such that we can quantify the solar radiative forcing this way. It is found to be an order of magnitude larger than changes in the irradiance, which is what the IPCC is claiming is to be the solar contribution.
After that work was published there was not a single paper that tried to refute it. Instead, additional satellite altimetry data covering two more solar cycles just revealed the same. In fact, the sun + el Niño Southern Oscillation can explain almost all the sea level variations minus the long term linear trend (caused by ice caps melting). This is from Howard et al. 2015 (see ref. #2 at the end):Figure 2: Satellite Altimetry based sea level (minus linear trend) in dashed blue points. Red is best fit model which includes solar cycle + el niño souther oscillation.
No papers refuted it because no one bothered.
The critical issue in science is.. what papers and further research supported it, since it’s a ten year old paper?
And the answer is.. none.
That’s why you’re talking about a ten year old paper.
lolSo, your defense against the charge of obsolete thinking is to parade your ignorance further? As you wish.
lol
Sorry, but your "refutation" simply does not work. You are literally copying and pasting from his blog post, which means you have not even tried to engage the problems with his claims. Nor have you recognized that if Shaviv is correct, then you cannot claim that UAH is an accurate measure of global temperature. Epic fail.
lolI guess you missed the part about TSI being an inadequate measure, and the rate of sea level rise being detrended from underlying ice-melt rise. You are having trouble following the material.
lol
OK then. If TSI is an "inadequate measure," then what is he using instead? And don't just quote a blog, answer in your own words, kthx.
lol... I also don't have to respond to your regurgitation of sentences that you clearly do not understand. 'Bye Felicia.Sorry, but you don't get to dictate what I post.
Sorry, but you don't get to dictate what I post.
[FONT="]". . . Because the solar correlated climate variations are large, but the total solar irradiance variations are relatively small (a few 0.1%), the latter are most likely not the explanation of climate variability. Instead, different amplifying mechanisms were suggested, mechanisms which can amplify the non-thermal components of the sun (e.g., UV, X-ray, solar wind) and which can considerably vary between an active sun and a quiet one.[/FONT]
[FONT="]The leading mechanism to explain the large solar induced climate variability is through solar wind modulation of the cosmic ray flux reaching the Earth, which affects climate through modulation of the amount of atmospheric ionization. Over the past decade, many different pieces of evidence added up to a pretty coherent picture. . . . "[/FONT]
CARBON DIOXIDE OR SOLAR FORCING?
lol... I also don't have to respond to your regurgitation of sentences that you clearly do not understand. 'Bye Felicia.
lol... I also don't have to respond to your regurgitation of sentences that you clearly do not understand. 'Bye Felicia.
[h=2]NASA: We Can’t Model Clouds, So Climate Models Are 100 Times Less Accurate Than Needed For Projections[/h]By Kenneth Richard on 29. August 2019
[h=4]NASA has conceded that climate models lack the precision required to make climate projections due to the inability to accurately model clouds. [/h]Clouds have the capacity to dramatically influence climate changes in both radiative longwave (the “greenhouse effect”) and shortwave.
Cloud cover domination in longwave radiation
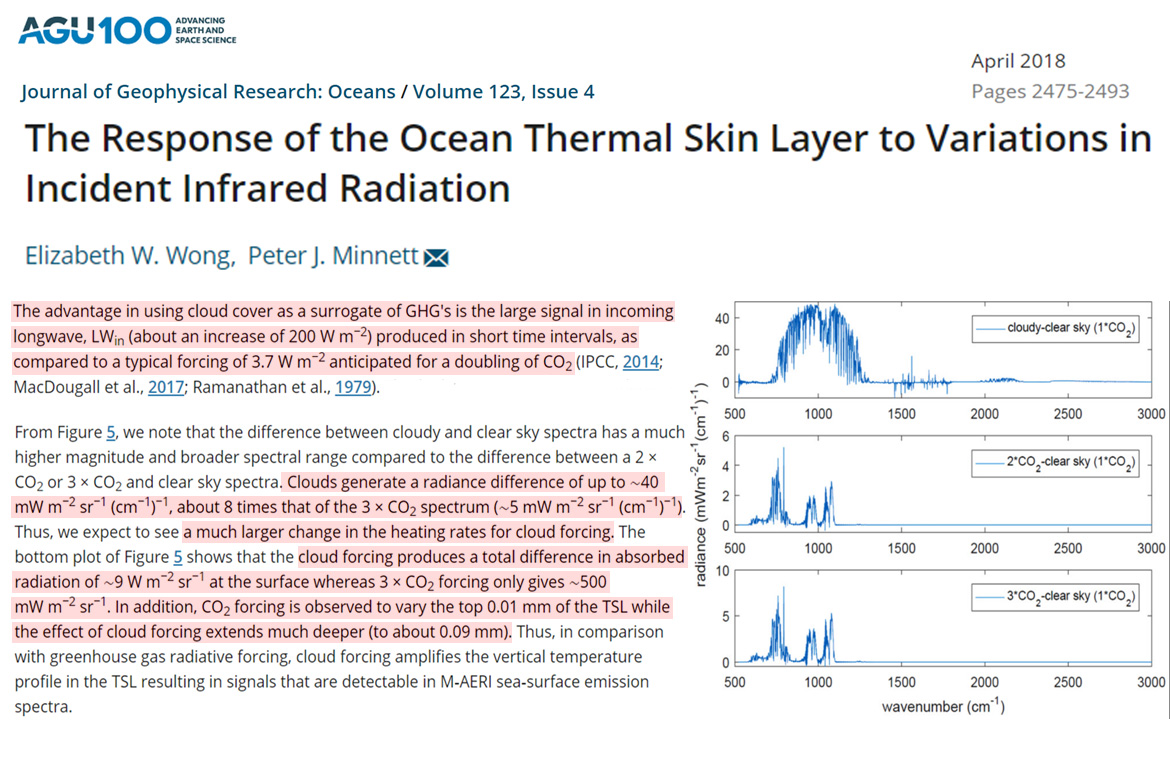
In the longwave, clouds thoroughly dwarf the CO2 climate influence. According to Wong and Minnett (2018):
• The signal in incoming longwave is 200 W/m² for clouds over the course of hours. The signal amounts to 3.7 W/m² for doubled CO2 (560 ppm) after hundreds of years.
• At the ocean surface, clouds generate a radiative signal 8 times greater than tripled CO2 (1120 ppm).
• The absorbed surface radiation for clouds is ~9 W/m². It’s only 0.5 W/m² for tripled CO2 (1120 ppm).
• CO2 can only have an effect on the first 0.01 mm of the ocean. Cloud longwave forcing penetrates 9 times deeper, about 0.09 mm.
[h=6]Image Source: Wong and Minnett, 2018[/h]Cloud cover domination in shortwave radiation
In its shortwave albedo capacity, cloud cover modulates the amount of solar radiation that warms the ocean. Changes in the Earth’s radiation budget “are caused by changes in tropical mean cloudiness.” (Wielicki et al., 2002).
When cloud cover increases, less shortwave radiation reaches the surface, leading to cooling. When cloud cover decreases – as it has since the 1980s – more solar radiation is absorbed.
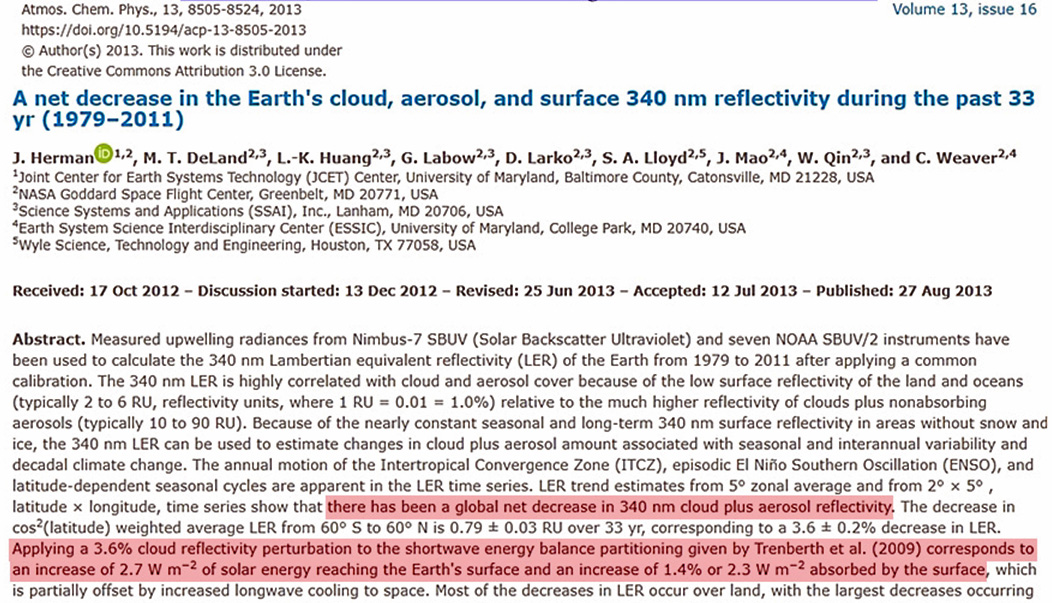
The decrease in cloud cover in recent decades can therefore explain the 1979-2017 warming (Herman et al., 2013, Poprovsky, 2019, Loeb et al., 2018).
[h=6]Image Source: Herman et al., 2013[/h]
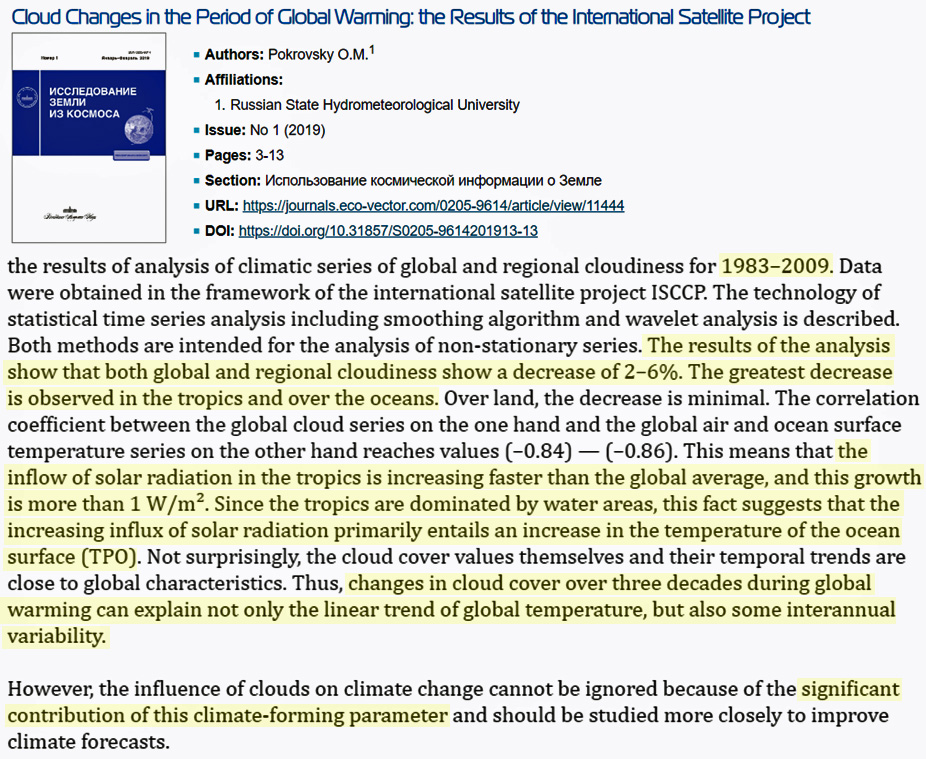
[h=6]Image Source: Poprovsky, 2019[/h]
[h=2]NASA: We Can’t Model Clouds, So Climate Models Are 100 Times Less Accurate Than Needed For Projections[/h]By Kenneth Richard on 29. August 2019
[h=4]NASA has conceded that climate models lack the precision required to make climate projections due to the inability to accurately model clouds. [/h]Clouds have the capacity to dramatically influence climate changes in both radiative longwave (the “greenhouse effect”) and shortwave.
Cloud cover domination in longwave radiation
In the longwave, clouds thoroughly dwarf the CO2 climate influence. According to Wong and Minnett (2018):
• The signal in incoming longwave is 200 W/m² for clouds over the course of hours. The signal amounts to 3.7 W/m² for doubled CO2 (560 ppm) after hundreds of years.
• At the ocean surface, clouds generate a radiative signal 8 times greater than tripled CO2 (1120 ppm).
• The absorbed surface radiation for clouds is ~9 W/m². It’s only 0.5 W/m² for tripled CO2 (1120 ppm).
• CO2 can only have an effect on the first 0.01 mm of the ocean. Cloud longwave forcing penetrates 9 times deeper, about 0.09 mm.
[h=6]Image Source: Wong and Minnett, 2018[/h]Cloud cover domination in shortwave radiation
In its shortwave albedo capacity, cloud cover modulates the amount of solar radiation that warms the ocean. Changes in the Earth’s radiation budget “are caused by changes in tropical mean cloudiness.” (Wielicki et al., 2002).
When cloud cover increases, less shortwave radiation reaches the surface, leading to cooling. When cloud cover decreases – as it has since the 1980s – more solar radiation is absorbed.
The decrease in cloud cover in recent decades can therefore explain the 1979-2017 warming (Herman et al., 2013, Poprovsky, 2019, Loeb et al., 2018).
[h=6]Image Source: Herman et al., 2013[/h]
[h=6]Image Source: Poprovsky, 2019[/h]
From the NASA source:
Unfortunately, such a margin of error is much too large for making a reliable forecast about climate changes, such as the global warming will result from increasing abundances of greenhouse gases in the atmosphere. A doubling in atmospheric carbon dioxide (CO2), predicted to take place in the next 50 to 100 years, is expected to change the radiation balance at the surface by only about 2 percent. Yet according to current climate models, such a small change could raise global mean surface temperatures by between 2-5°C (4-9°F), with potentially dramatic consequences. If a 2 percent change is that important, then a climate model to be useful must be accurate to something like 0.25%. Thus today's models must be improved by about a hundredfold in accuracy, a very challenging task. To develop a much better understanding of clouds, radiation and precipitation, as well as many other climate processes, we need much better observations.
ISCCP: Cloud Climatology