- Joined
- Jul 19, 2012
- Messages
- 14,185
- Reaction score
- 8,768
- Location
- Houston
- Gender
- Male
- Political Leaning
- Libertarian
Richard Lindzen of MIT writing in the Journal of American Physicians and Surgeons identifies characteristics of politicized science:
In politicized science the science becomes a source of authority whereas non-political science is a source of inquiry. The utility of science in furthering knowledge comes from the latter and not the former.
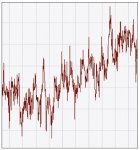
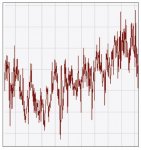
With regard to the IPCC's claims, Lindzen produced two graphs showing temperature change during a 50 year period, one taken from a period before there was a significant increase in CO2, and the other more recently when the increase in CO2 was marked and accelerating. Can you tell which is which?


According to the IPCC the first plot, representing the period 1957 to 2008, shows a significant increase in temperature due to CO2, which increased by about 80 ppm during that time, but it is not significantly different from the second plot, which is the period 1895 to 1946 during which atmospheric CO2 increased by about 10 ppm. Lindzen concludes that the data provides no basis for the IPCC claims of Catastrophic Anthropogenic (human caused) Global warming (CAGW).
1) powerful advocacy groups claiming morality and superior wisdom; 2) simplistic depictions of the science; 3) events claimed to promote a sense of urgency; 4) scientists flattered by the public attention and 5) scientists eager to meet the public demand.
In politicized science the science becomes a source of authority whereas non-political science is a source of inquiry. The utility of science in furthering knowledge comes from the latter and not the former.
With regard to the IPCC's claims, Lindzen produced two graphs showing temperature change during a 50 year period, one taken from a period before there was a significant increase in CO2, and the other more recently when the increase in CO2 was marked and accelerating. Can you tell which is which?


According to the IPCC the first plot, representing the period 1957 to 2008, shows a significant increase in temperature due to CO2, which increased by about 80 ppm during that time, but it is not significantly different from the second plot, which is the period 1895 to 1946 during which atmospheric CO2 increased by about 10 ppm. Lindzen concludes that the data provides no basis for the IPCC claims of Catastrophic Anthropogenic (human caused) Global warming (CAGW).
