Hate to break it to you... Your graph is off by a couple years... Sorry...
Then again, you should've notices, when both the WWII debt spike on your graph occurs after the war is over... And when the massive spike for the current debt you have all on Bush and none on Obama... Cute how that works...
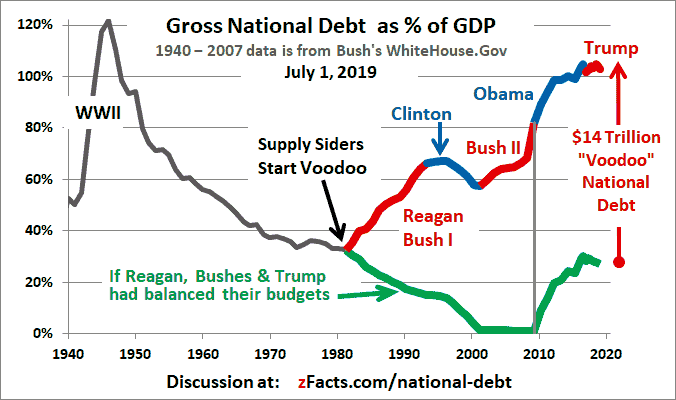
See, the other indicator would've been that you have Bush leaving office with the debt to GDP ratio of around 90%... when it was actually well below that when Bush left office... At the worst case scenario the debt was $10.5T, and the GDP was $14T... making it 75%... just "slightly" off by 15% points... no biggie...
See here it is in nominal dollars...
Massive spike under Obama... which you tried to hide as nominal only, as if inflation from 2009-2009 was the major cause of the spike... not the massive spending, and the craterous deficit which was created...
Here it is in Debt to GDP ratio, more accurately than what you have here...
See where the massive spike in Debt to GDP ratio also occurs... Under Obama... largely because of his increases to Bush's last budget... from $2.7T to $3.1T
Then, unfortunately what these graphs don't show, is in the following years, when he increases that $3.1T to $3.6T, $3.8T, $3.7T, and $3.8T, how the Debt to GDP ratio goes over 100% again for only the 2nd time in our nation's history...
It's not so much that the Republicans have a history of cutting... there has clearly been a mixed bag... However, what has been shown is that Democrats throw money around like it doesn't actually have a value in times of crisis... and that has lead to several severe explosions of our debt... for WWI, the depression, WII, and now Obama's decision to "stimulate" the economy, by making it dependent on grant money...
Fiscally responsible Republicans have cut the deficits and the debt over time... and if you go back and do this same type of chart by party affiliation of the Senate and Congress, you could get an eye opener on who effects the budgetary situation in what manner...