• This is a political forum that is non-biased/non-partisan and treats every person's position on topics equally. This debate forum is not aligned to any political party. In today's politics, many ideas are split between and even within all the political parties. Often we find ourselves agreeing on one platform but some topics break our mold. We are here to discuss them in a civil political debate. If this is your first visit to our political forums, be sure to check out the RULES. Registering for debate politics is necessary before posting. Register today to participate - it's free!

Mapping the rise of killer heatwaves

Surface Detail

DP Veteran
Joined
Sep 20, 2016
Messages
3,244
Reaction score
1,232
Location
English Midlands
Gender
Undisclosed
Political Leaning
Centrist
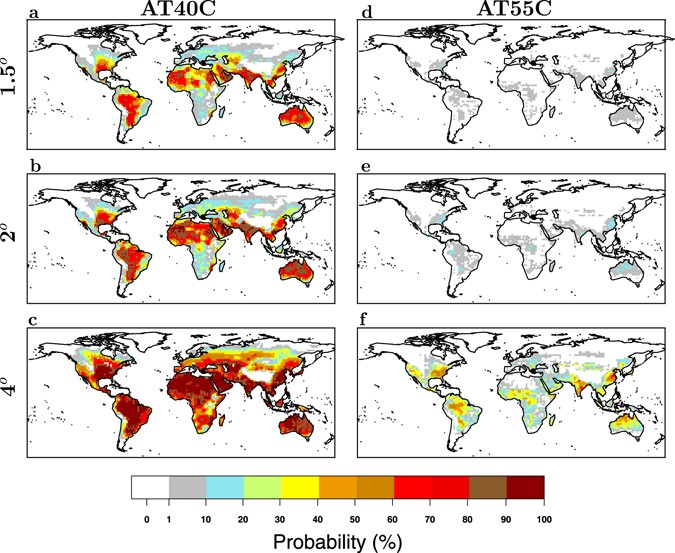
Following on from Hansen's prediction that most of the world will ultimately become uninhabitable if the use of fossil fuels is not curtailed, a recent Nature paper shows in more detail which parts of the world will start to struggle as the heat and humidity rises. A 2°C rise is likely to cause major problems in places like India, while a 4°C rise will bring killer heatwaves to China and the Eastern US.

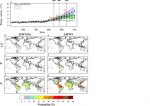
Humid heat waves at different warming levels

41598_2017_7536_Fig3_HTML.jpg


Annual probability of occurrence of a heat waves with apparent temperature peaks greater than 40 °C and 55 °C.

An apparent temperature (aka heat index) of 40 °C is very dangerous for e.g. elderly people, while an AT of 55 °C is not survivable for more than a few hours.
 
Well, too bad they use a two bad modelling methods. RCP 8.5 and CMIP5.

They left out part of the graphic from the journal:

Untitled.jpg

Additionally, by using daily maximum temperature and minimum relative humidity outputs from the Coupled Model intercomparison Project Phase 5 (CMIP518), we project heat wave and apparent heat wave magnitudes at different warming levels (1.5°, 2° and 4°) relative to the period 1861–1880 (see method). In order to show the potential impact of the combination of temperature and relative humidity on human health during a heat wave, we consider AT peak (AT peak ) defined as the maximum AT value during a heat wave (see method).
 

Attachments

  • Untitled.jpg
    Untitled.jpg
    22 KB · Views: 107
What to you mean? The graphic you posted is also in the article that I linked to. And why you think the models are bad?

But it excluded the inconvenient truth that it used the RCP 8.5 scenario modeling.
 
But it excluded the inconvenient truth that it used the RCP 8.5 scenario modeling.

You seem to be missing the point of the paper, which is to quantify the likelihood of heatwaves occurring in different places if the mean global temperature were to rise by 1.5°C, 2°C or 4°C respectively. The RPC 8.5 scenario corresponds to the unchecked rise in emissions resulting from a business-as-usual future with no curbs on fossil fuel emissions. The paper is not saying that RPC 8.5 will happen; it's saying what the consequences are likely to be if RPC 8.5 is allowed to happen.
 
You seem to be missing the point of the paper, which is to quantify the likelihood of heatwaves occurring in different places if the mean global temperature were to rise by 1.5°C, 2°C or 4°C respectively. The RPC 8.5 scenario corresponds to the unchecked rise in emissions resulting from a business-as-usual future with no curbs on fossil fuel emissions. The paper is not saying that RPC 8.5 will happen; it's saying what the consequences are likely to be if RPC 8.5 is allowed to happen.

Without RCP 8.5, it cannot happen. Emissions are already lower than projected.
 
Without RCP 8.5, it cannot happen. Emissions are already lower than projected.

It is a good thing that widespread adoption of renewable energy sources and, in the US, a shift from coal to gas has reduced emissions to date somewhat below RCP 8.5. However, we are still highly likely to hit 2°C, and 4°C will still be reached if global efforts towards a reduction in emissions are not maintained.
 
It is a good thing that widespread adoption of renewable energy sources and, in the US, a shift from coal to gas has reduced emissions to date somewhat below RCP 8.5. However, we are still highly likely to hit 2°C, and 4°C will still be reached if global efforts towards a reduction in emissions are not maintained.

Complete alarmist nonsense. Climate sensitivity per CO2 doubling is almost certainly 1.0 - 1.5C. This is just a scare tactic.
 
Oh... misread. Thought there was a bunch of killer housewives on the loose.

Carry on.
 
Complete alarmist nonsense. Climate sensitivity per CO2 doubling is almost certainly 1.0 - 1.5C. This is just a scare tactic.

I'm afraid you have been misled.

This recent study, published in Nature, suggests a central estimate of 2.8°C with 66% confidence limits (equivalent to the IPCC 'likely' range) of 2.2 – 3.4°C. They calculate the probability of ECS being less than 1.5°C to be less than 3%.

Emergent constraint on equilibrium climate sensitivity from global temperature variability

They are wrong.

ON CLIMATE SENSITIVITY AND WHY IT IS PROBABLY SMALL

ON IPCCS EXAGGERATED CLIMATE SENSITIVITY AND THE EMPEROR’S NEW CLOTHES

. . . In any case, irrespective of whether you favor the global data, or the oceanic data, it is clear the the temperature with its fluctuations is inconsistent with the "high estimate" in the IPCC-FAR (and it has been the case for a decade if you take the oceanic temperature, or half a decade, if you take the global temperature, not admitting that it is biased). In fact, it appears that only the low estimate can presently be consistent with the observations. Clearly then, earth's climate sensitivity should be revised down, and the upper range of sensitivities should be discarded and with it, the apocalyptic scenarios which they imply. For some reason, I doubt that the next AR5 report will consider this inconsistency, nor that they will revise down the climate sensitivity (and which is consistent with other empirical indicators of climate sensitivity). I am also curious when will the general public realize that the emperor has no clothes.

Of course, Andrew commented that the alarmists will always claim that there might be something else which has been cooling, and we will pay for our CO2 sevenfold later. The short answer is that “you can fool some of the people some of the time, but you cannot fool all of the people all of the time!” (or as it should be adapted here, “you cannot fool most of the people indefinitely!”).

The longer answer is that even climate alarmists realize that there is a problem, but they won’t admit it in public. In private, as the climategate e-mails have revealed, they know it is a problem. In October 2009, Kevin Trenberth wrote his colleagues:
The fact is that we can't account for the lack of warming at the moment and it is a travesty that we can't. The CERES data published in the August BAMS 09 supplement on 2008 shows there should be even more warming: but the data are surely wrong. Our observing system is inadequate.​
However, instead of reaching the reasonable conclusion that the theory should be modified, the data are "surely wrong". (This, btw, is a sign of a new religion, since no fact can disprove the basic tenets).

When you think of it, those climatologists are in a rather awkward position. If you exclude the denial option (apparent in the above quote), then the only way to explain the “travesty” is if you have a joker card, something which can provide warming, but which the models don’t take into account. It is a catch-22 for the modelers. If they admit that there is a joker, it disarms their claim that since one cannot explain the 20th century warming without the anthropogenic contribution, the warming is necessarily anthropogenic. If they do not admit that there is a joker, they must conclude (as described above) that the climate sensitivity must be low. But if it is low, one cannot explain the 20th century without a joker. A classic Yossarian dilemma.

This joker card is of course the large solar effects on climate.
 
Last edited:
They are wrong.

ON CLIMATE SENSITIVITY AND WHY IT IS PROBABLY SMALL

ON IPCCS EXAGGERATED CLIMATE SENSITIVITY AND THE EMPEROR’S NEW CLOTHES

[FONT=&]. . . In any case, irrespective of whether you favor the global data, or the oceanic data, it is clear the the temperature with its fluctuations is inconsistent with the "high estimate" in the IPCC-FAR (and it has been the case for a decade if you take the oceanic temperature, or half a decade, if you take the global temperature, not admitting that it is biased). In fact, it appears that only the low estimate can presently be consistent with the observations. Clearly then, earth's climate sensitivity should be revised down, and the upper range of sensitivities should be discarded and with it, the apocalyptic scenarios which they imply. For some reason, I doubt that the next AR5 report will consider this inconsistency, nor that they will revise down the climate sensitivity (and which is consistent with [/FONT]other empirical indicators of climate sensitivity[FONT=&]). I am also curious when will the general public realize that the emperor has no clothes. [/FONT]

[FONT=&]Of course, Andrew commented that the alarmists will always claim that there might be something else which has been cooling, and we will pay for our CO2 sevenfold later. The short answer is that “you can fool some of the people some of the time, but you cannot fool all of the people all of the time!” (or as it should be adapted here, “you cannot fool most of the people indefinitely!”). [/FONT]

[FONT=&]The longer answer is that even climate alarmists realize that there is a problem, but they won’t admit it in public. In private, as the climategate e-mails have revealed, they know it is a problem. In October 2009, Kevin Trenberth wrote his colleagues:[/FONT]
The fact is that we can't account for the lack of warming at the moment and it is a travesty that we can't. The CERES data published in the August BAMS 09 supplement on 2008 shows there should be even more warming: but the data are surely wrong. Our observing system is inadequate.​
[FONT=&]However, instead of reaching the reasonable conclusion that the theory should be modified, the data are "surely wrong". (This, btw, is a sign of a new religion, since no fact can disprove the basic tenets). [/FONT]

[FONT=&]When you think of it, those climatologists are in a rather awkward position. If you exclude the denial option (apparent in the above quote), then the only way to explain the “travesty” is if you have a joker card, something which can provide warming, but which the models don’t take into account. It is a catch-22 for the modelers. If they admit that there is a joker, it disarms their claim that since one cannot explain the 20th century warming without the anthropogenic contribution, the warming is necessarily anthropogenic. If they do not admit that there is a joker, they must conclude (as described above) that the climate sensitivity must be low. But if it is low, one cannot explain the 20th century without a joker. A classic Yossarian dilemma. [/FONT]

[FONT=&]This joker card is of course the large solar effects on climate. [/FONT]
No, I think it is more likely to be you who is wrong.

On the whole, I'd say an article published in Nature just a couple of weeks ago is a far more credible source than a couple of ancient blog posts. Shaviv's theory has been all but disproven over the last few years by the failure of reality to follow its predictions.

That's where you're uninformed. Reality has in fact reinforced Shaviv's position.
Moreover, the Nature article follows the sad pattern of desperate defenses of high sensitivity because without that the whole AGW edifice of fear comes tumbling down. Step by grudging step, reality is exposed.
 
That's where you're uninformed. Reality has in fact reinforced Shaviv's position.
Moreover, the Nature article follows the sad pattern of desperate defenses of high sensitivity because without that the whole AGW edifice of fear comes tumbling down. Step by grudging step, reality is exposed.

A strange world it is that you live in, Jack, where recent Nature articles are "desperate defenses" while ancient blog posts are definitive!

Shaviv's theory was debunked years ago, e.g. by Cosmic rays, solar activity and the climate. Furthermore, global temperatures have continues to rise as solar output has fallen, directly contradicting Shaviv's claims. Time to let this one go, Jack!

20th century warming is better explained by solar/GCR than by AGW, and there's been virtually no warming 1998-2018. Your "debunking" was nothing more than a set-up against a strawman.
 
20th century warming is better explained by solar/GCR than by AGW, and there's been virtually no warming 1998-2018. Your "debunking" was nothing more than a set-up against a strawman.

Wrong again, Jack.

graph.png


The temperature has risen as fast as ever over the past 20 years, while solar activity has fallen.

It is you who is sounding desperate here.
 
Wrong again, Jack.

graph.png


The temperature has risen as fast as ever over the past 20 years, while solar activity has fallen.

It is you who is sounding desperate here.

"Estimates." Whatever.

UAH-1979-2017.jpg

Meanwhile, Richard Lindzen:

The emphasis on “warmest years on record” appears to have been a response to the observation that the warming episode from about 1978 to 1998 appeared to have ceased and temperatures have remained almost constant since 1998. Of course, if 1998 was the hottest year on record, all the subsequent years will also be among the hottest years on record, since the temperature leveled off at that year and continued into the subsequent years—all of which are now as hot as the record year of 1998. None of this contradicts the fact that the warming (i.e., the increase of temperature) has ceased.

Jack, we've already done this to death, and it has little to do with the OP. Neither graph shows the fall in global temperature that would have occurred with falling solar activity if Shaviv had been correct about solar influences being more important than greenhouse effects. You're clutching at non-existent straws.
 
Jack, we've already done this to death, and it has little to do with the OP. Neither graph shows the fall in global temperature that would have occurred with falling solar activity if Shaviv had been correct about solar influences being more important than greenhouse effects. You're clutching at non-existent straws.

Not at all. No one knows the "turnaround time" as climate trends shift, and keep in mind that as of 2017 global temperature is falling.
 
It is a good thing that widespread adoption of renewable energy sources and, in the US, a shift from coal to gas has reduced emissions to date somewhat below RCP 8.5. However, we are still highly likely to hit 2°C, and 4°C will still be reached if global efforts towards a reduction in emissions are not maintained.

Maybe if we don't stop our aerosols from melting ice. However, CO2 is not the boogyman you believe it to be. As the imbalance of CO2 to the partial pressure the ocean needs for equalization increases, the velocity of absorption increases too. It is next to impossible for us to pout enough CO2 in the atmosphere for it to affect temperature so dramatically. We would have to try tom increase CO2 levels.
 
I'm afraid you have been misled.

This recent study, published in Nature, suggests a central estimate of 2.8°C with 66% confidence limits (equivalent to the IPCC 'likely' range) of 2.2 – 3.4°C. They calculate the probability of ECS being less than 1.5°C to be less than 3%.

Emergent constraint on equilibrium climate sensitivity from global temperature variability

Yes, yes, yes. The same modeling techniques that are have problems are being used. The Hasselmann model, CMIP5, etc.

As long as the same scenarios are used that have already proven are wrong 95% of the time, the results will be wrong.

Garbage in, garbage out.
 
No, I think it is more likely to be you who is wrong.

On the whole, I'd say an article published in Nature just a couple of weeks ago is a far more credible source than a couple of ancient blog posts. Shaviv's theory has been all but disproven over the last few years by the failure of reality to follow its predictions.

How that ever made it to print is beyond me. They use Wikipedia as one of their sources.
 
Wrong again, Jack.

graph.png


The temperature has risen as fast as ever over the past 20 years, while solar activity has fallen.

It is you who is sounding desperate here.

And the source link for that graph is???
 
Back
Top Bottom