• This is a political forum that is non-biased/non-partisan and treats every person's position on topics equally. This debate forum is not aligned to any political party. In today's politics, many ideas are split between and even within all the political parties. Often we find ourselves agreeing on one platform but some topics break our mold. We are here to discuss them in a civil political debate. If this is your first visit to our political forums, be sure to check out the RULES. Registering for debate politics is necessary before posting. Register today to participate - it's free!

Ice Melt is 20 Years Ahead of Schedule

That actual insulation data is being ignored by the IPCC et. al.
Isolation data is not used by the IPCC because all of the different aerosols are being assessed separately as a radiative forcing for each kind because they don't all do the same thing. Some absorb radiation while others reflect or even scatter it.

To say that the IPCC is ignoring isolation is pretty much a lie.

For someone who claims to have the IPCC's AR5 on your hard-drive you certainly seem ignorant of much of it.

I have explained this so many times over the years, I am tired of people conveniently forgetting.

The sun started coming out of the Maunder Minima in 1713, according to the best science we have. The peak intensity of the sun was 1958. It has diminished somewhat since then, but is still hotter than the 200 year period before 1900. Into the late 30's and early 40's, we recorded record temperatures that until "corrected," were higher than temperatures we see today. The 40's is when our dirtying up the skies with aerosols stared mitigating the warming we are now finally seeing as the skies clear.

If other variables were static, the suns effect alone with ocean equalization would be close to this:

tYXaTbJ.png


The oceans are highly affected by surface insolation, and so is the solid ground. However, the ground only takes a few months to equalize, but the ocean takes around 100 years to equalize to 60%.

We started diminishing the sun's insolation to the surface with industrialization, and this effect of reducing the warming power of the sun continued past the 70's. Once we emitted less aerosols into the sky, it took decades for all the smallest of aerosols to clear out. As the aerosols cleared out, we had a period of time after a980, the the earth got warmer and warmer as more sun could strike the surface.
I was meaning to ask... did you ever find any data or studies to back this up or is it still nothing but wild speculation?
 
Isolation data is not used by the IPCC because all of the different aerosols are being assessed separately as a radiative forcing for each kind because they don't all do the same thing. Some absorb radiation while others reflect or even scatter it.

To say that the IPCC is ignoring isolation is pretty much a lie.

For someone who claims to have the IPCC's AR5 on your hard-drive you certainly seem ignorant of much of it.


I was meaning to ask... did you ever find any data or studies to back this up or is it still nothing but wild speculation?
There lies one of the problems.

Forcing and insolation are two different things.

Please try to comprehend that.

Accounting for the forcing of aerosols is only accounting for the longwave changes while ignoring the shortwave changes.
 
Isolation data is not used by the IPCC because all of the different aerosols are being assessed separately as a radiative forcing for each kind because they don't all do the same thing. Some absorb radiation while others reflect or even scatter it.

To say that the IPCC is ignoring isolation is pretty much a lie.

For someone who claims to have the IPCC's AR5 on your hard-drive you certainly seem ignorant of much of it.


I was meaning to ask... did you ever find any data or studies to back this up or is it still nothing but wild speculation?


This poster and several others keep digging up data/facts that are correct in and of themselves but by which they draw their own conclusion as if thereby scientific and accuse the IPCC of ignoring such. They just keep repeating the same argument/data and occasionally dig up something and info-spam you on another post nothing more than data that is already reflected in manner as you just described in this post of yours. Then they accuse you of denying science when they can't get other science community backing for their own conclusion and themselves ignore the consensus/majority/scientific community position given in IPCC reports. Insolation, solar radiation, hardly varies with no significant contribution to global warming over the period of time that global warming has increased the most in the last 800,000 yrs., which is over the last 70 yrs. Then, given the conclusive facts, these posters will just keep coming back with more reply of insignificant question and conclusion/opinion/refutation not supported by the science community. They don't stop with their misleading approach to debate.
 
Accounting for the forcing of aerosols is only accounting for the longwave changes while ignoring the shortwave changes.
That is just not true. Go read that IPCC report you have on your hard-drive.
 
That is just not true. Go read that IPCC report you have on your hard-drive.
I went looking for what changes in insolation the IPCC accounted for.
https://www.ipcc.ch/sr15/chapter/chapter-3/
"Changes in insolation forcing during the HTM (Marcott et al., 2013)
and the LIG (Hoffman et al., 2017) led to a global temperature up to 1°C higher than that in the pre-industrial period (1850–1900);"

now these are fine words, but Marcott only found insolation differences before 1900,
and Hoffman, was about ocean temperatures, and mention insolation in pre history.
Neither would apply to recent observed changes in the solar energy reaching Earth's surface.
 
That is just not true. Go read that IPCC report you have on your hard-drive.
Please show me the applicable paragraph where they talk about the insolation changes and show the data, and how they treat it. I have never seen it.
 
That is just not true. Go read that IPCC report you have on your hard-drive.
Wow. Displaying your ignorance again. That is a recent special report. Not part of any assessment report I have on my computer, and I have all five.

You obviously didn't understand what the report says. They attribute a 1 degree anomaly in temperature for a period between 5,000 to 10,000 years , using the 1850 to 1900 global tempoerture as a baseline, and attributing it to insolation changes. They don't specify if it's TOA, Tropopause, ot surface insolation. They paper probably specifies which, but I haven't read it yet. That part doesn't matter. Your amateurish interpretation does.

They don't mention the insolation changes at all, in any of their assessment period for anthropogenic warming after 1750. They only claim the 1 degree insolation change, without telling us that insolation may be the reason we see warming today.

They still ignore that concept!
 
Buzz, to add. I found the complete report instead of the single chapter you linked. The only other place the word "insolation" appears is on page 324:

The feasibility of renewable energy options depends to a large
extent on geophysical characteristics of the area where the option is
implemented. However, technological advances and policy instruments
make renewable energy options increasingly attractive in other areas.
For example, solar PV is deployed commercially in areas with low solar
insolation, like northwest Europe (Nyholm et al., 2017). Feasibility also
depends on grid adaptations (e.g., storage, see below) as renewables
grow (IEA, 2017c). For regions with high energy needs, such as
industrial areas (see Section 4.3.4), high-voltage DC transmission
across long distances would be needed (MacDonald et al., 2016).
 
I went looking for what changes in insolation the IPCC accounted for.
https://www.ipcc.ch/sr15/chapter/chapter-3/
"Changes in insolation forcing during the HTM (Marcott et al., 2013)
and the LIG (Hoffman et al., 2017) led to a global temperature up to 1°C higher than that in the pre-industrial period (1850–1900);"

now these are fine words, but Marcott only found insolation differences before 1900,
and Hoffman, was about ocean temperatures, and mention insolation in pre history.
Neither would apply to recent observed changes in the solar energy reaching Earth's surface.

Please show me the applicable paragraph where they talk about the insolation changes and show the data, and how they treat it. I have never seen it.

God damn, you two... I said AR5 and that the changes in aerosols are discussed under the aerosol section of the report and not in any major discussion of insolation.

Now if you two want to continue being ignorant of what the IPCC and climate science says about aerosols, that is just fine. But please... stop using your ignorance as an argument against AGW.
We can discuss aerosols, as related to AR5, but there is not much there.
The caption on figure 3 mentions aerosols.
"Figure SPM.3 | Assessed likelyranges (whiskers) and their mid-points (bars) for warming trends over the 1951–2010 period from well-mixed greenhouse gases, other anthropogenic forcings (including the cooling effect of aerosols and the effect of land use change), combined anthropogenic forcings, natural forcings and natural internal climate variability (which is the element of climate variability that arises spontaneously within the climate system even in the absence of forcings)."
But if they only counted the cooling effects of aerosols, they missed the other half of the story!
 
God damn, you two... I said AR5 and that the changes in aerosols are discussed under the aerosol section of the report and not in any major discussion of insolation.

Now if you two want to continue being ignorant of what the IPCC and climate science says about aerosols, that is just fine. But please... stop using your ignorance as an argument against AGW.
Why don't you quote the passage?

You claim to be aware of something. I say it's a figment of your delusional indoctrination.

I have specified measured surface insolation due to aerosol changes. The only surface insolation changes I am aware of in the AR5, or any other assessment report, is isolation due to celestial movements, and modeled insolation changes. Not measured, but modeled.

They acknowledge the dimming and brightening, and state that their models miscalculates in excess of 20%. Part of this is because they are only looking at SO2 at 550 nm.

They don't speak of aerosols in any meaningful way.
 
Admit it Buzz...

They don't quantify the insolation changes due to aerosols. If they did, they wouldn't be able to justify the AGW scare.
 

Greenland and the 1950s Climate Consensus
Glaciers around the world reached their greatest size in four thousand years by 1850. Then abruptly the world began to warm. Arctic sea ice lost 40% of its thickness by 1940.
Continue reading →


Jim Steele is a relative lone voice. This opinion piece of his is not in any way considered by consensus science as an indication that natural warming has any significant impact on the rise in global warming or that such refutes AGW. More info spam w/o you, Jack, even taking a position in the matter in any declarative fashion, as usual.
 
Jim Steele is a relative lone voice. This opinion piece of his is not in any way considered by consensus science as an indication that natural warming has any significant impact on the rise in global warming or that such refutes AGW. More info spam w/o you, Jack, even taking a position in the matter in any declarative fashion, as usual.
If I did not think Steele's view had merit I would not have posted it.

". . . The theory that the NAO and shifting winds create the conditions that drive Greenland’s warming and cooling is supported by all observable evidence. Greenland lost ice in the 1930s then gained ice in the 1970s and 80s. Although Greenland’s ice has been melting extensively in recent decades, that melt rate is now slowing and the shifting NAO suggests the ice will rebound. In contrast, the competing CO2-global warming theory suggests as CO2 continues to rise, Greenland’s ice will increasingly melt and dramatically raise sea levels. That theory has prompted calls to abandon our coastlines and invest in managed retreat. But before you panic, know your climate history and listen to the science. All the science! . . ."
 

The Arctic “Death Spiral”: Lamenting the Collapse of a 4000 Year Old Ice Shelf
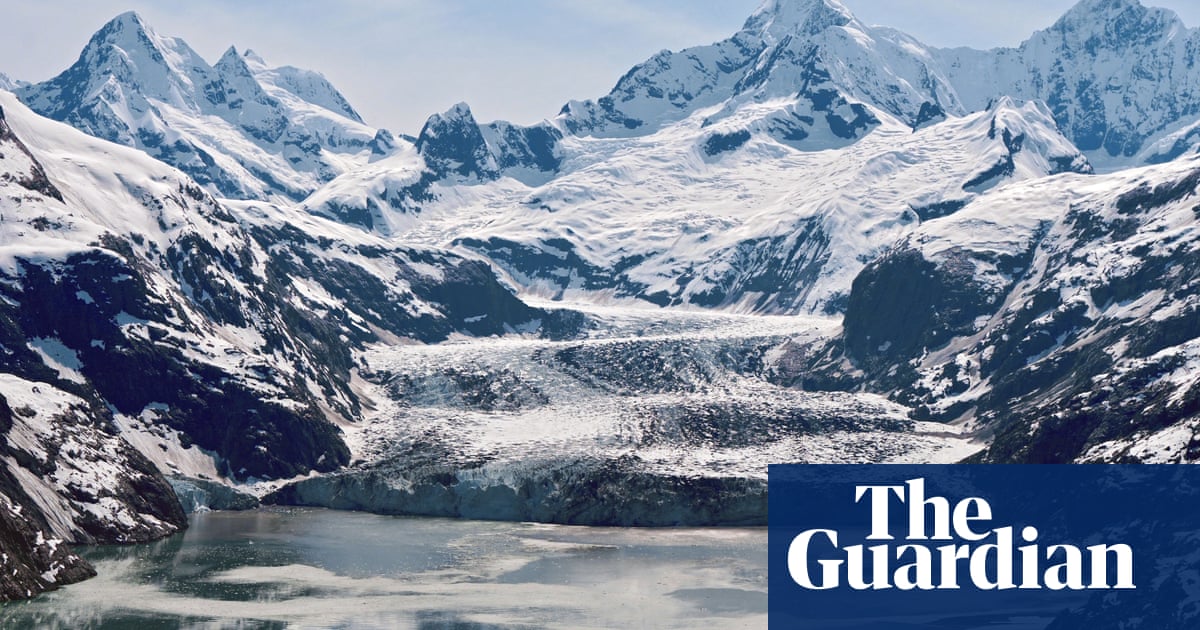
The Guardian wants you to weep for an ice shelf which even they admit didn’t exist back when the Egyptian Pyramids were being constructed. They demand we doing everything in our power to prevent the ice melt from uncovering vast deposits of gold and precious minerals, and opening valuable new sea routes.
Continue reading →
The AGW crowd will tell you that the ice shelf they are talking about must have melted because the Goa'uld were on the earth back then. They had their slave labor and technology mining the naquadah. When the Goa'uld left earth, the ice shelves returned.
 
If I did not think Steele's view had merit I would not have posted it.

". . . The theory that the NAO and shifting winds create the conditions that drive Greenland’s warming and cooling is supported by all observable evidence. Greenland lost ice in the 1930s then gained ice in the 1970s and 80s. Although Greenland’s ice has been melting extensively in recent decades, that melt rate is now slowing and the shifting NAO suggests the ice will rebound. In contrast, the competing CO2-global warming theory suggests as CO2 continues to rise, Greenland’s ice will increasingly melt and dramatically raise sea levels. That theory has prompted calls to abandon our coastlines and invest in managed retreat. But before you panic, know your climate history and listen to the science. All the science! . . ."
[/]

I'm not saying Steele is a lone voice in the accuracy of his scientific data. I'm saying any conclusion as to his science affecting AGW is a lone voice. So, yes, all the science is being considered, including NAO by the IPCC.

Missed wind patterns are throwing off climate forecasts of rain and storms:

https://www.sciencemag.org/news/202...re-throwing-climate-forecasts-rain-and-storms

“…because ENSO and NAO are key determinants of regional climate change and can possibly result in abrupt and counter intuitive changes, there has been an increase in uncertainty in those aspects of climate change that critically depend on regional changes.”

https://archive.ipcc.ch/ipccreports/tar/vol4/index.php?idp=93

“Climate change may manifest itself both as shifting means as well as changing preference of specific regimes, as evidenced by the observed trend toward positive values for the last 30 years in the NAO index…”

(see pg 420, 3rd new para)
https://www.ipcc.ch/site/assets/uploads/2018/03/TAR-07.pdf

You might also want to take a look at pages 451-455. Without picking out anything in particular, my conclusion to do with the info in these pages is that NAO is affected by SSS (Sea Surface Temperature) just as SSS affects wind and SSS is affected by AGW, though less so than is land surface temp. Thus, as is later questioned in these pages, it is logical that it is, indeed, AGW that is causing NAO variability. Plus, NAO is a regional variability and can’t be shown to affect the conclusion of the IPCC that the major cause of GW is anthropogenic of which most is emission of CO2 by man.

Again, you info spam w/o saying anything yourself. You don’t really take a position. You might as well just link to the dictionary and say it’s all in there. Nothing said by Steele, an AGW denier, changes science consensus. The science of what you purport have no natural affect on rising global temp., only regional weather that does affect regional climate which existing climate models have not picked up. It’s more of a weather thing.
 
We can discuss aerosols, as related to AR5, but there is not much there.
The caption on figure 3 mentions aerosols.
"Figure SPM.3 | Assessed likelyranges (whiskers) and their mid-points (bars) for warming trends over the 1951–2010 period from well-mixed greenhouse gases, other anthropogenic forcings (including the cooling effect of aerosols and the effect of land use change), combined anthropogenic forcings, natural forcings and natural internal climate variability (which is the element of climate variability that arises spontaneously within the climate system even in the absence of forcings)."
But if they only counted the cooling effects of aerosols, they missed the other half of the story!
Why don't you quote the passage?

You claim to be aware of something. I say it's a figment of your delusional indoctrination.

I have specified measured surface insolation due to aerosol changes. The only surface insolation changes I am aware of in the AR5, or any other assessment report, is isolation due to celestial movements, and modeled insolation changes. Not measured, but modeled.

They acknowledge the dimming and brightening, and state that their models miscalculates in excess of 20%. Part of this is because they are only looking at SO2 at 550 nm.

They don't speak of aerosols in any meaningful way.
Admit it Buzz...

They don't quantify the insolation changes due to aerosols. If they did, they wouldn't be able to justify the AGW scare.
Well... it looks like longview and Lord of Planar are in need of some schooling on what the IPCC's AR5 says about aerosols.

This class is in session...

Let's start in the Technical summary section TS3.3:
Anthropogenic aerosols are responsible for an RF of climate through
multiple processes which can be grouped into two types: aerosol–radiation
interactions (ari) and aerosol–cloud interactions (aci). There has
been progress since AR4 on observing and modelling climate-relevant
aerosol properties (including their size distribution, hygroscopicity,
chemical composition, mixing state, optical and cloud nucleation properties)
and their atmospheric distribution. Nevertheless, substantial
uncertainties remain in assessments of long-term trends of global
aerosol optical depth and other global properties of aerosols due to
difficulties in measurement and lack of observations of some relevant
parameters, high spatial and temporal variability and the relatively
short observational records that exist.
Then the real discussion starts in section 2.2.3:
This section assesses trends in aerosol resulting from both anthropogenic
and natural sources. The significance of aerosol changes for
global dimming and brightening is discussed in Section 2.3. Chapter 7
provides additional discussion of aerosol properties, while Chapter 8
discusses future RF and the ice-core records that contain information
on aerosol changes prior to the 1980s. Chapter 11 assesses air quality–
climate change interactions. Because of the short lifetime (days to
weeks) of tropospheric aerosol, trends have a strong regional signature.
Aerosol from anthropogenic sources (i.e., fossil and biofuel burning)
are confined mainly to populated regions in the NH, whereas aerosol
from natural sources, such as desert dust, sea salt, volcanoes and
the biosphere, are important in both hemispheres and likely dependent
on climate and land use change (Carslaw et al., 2010).
There are a few pages after this that describe the trends of aerosols.

And there is more...
 
And here is a summary from 2.3 concerning changes in radiation budgets:
In summary, the evidence for widespread multi-decadal variations in
solar radiation incident on land surfaces has been substantiated since
AR4, with many of the observational records showing a decline from
the 1950s to the 1980s (‘dimming’), and a partial recovery thereafter
(‘brightening’). Confidence in these changes is high in regions with
high station densities such as over Europe and parts of Asia. These
likely changes are generally supported by observed changes in related,
but more widely measured variables, such as sunshine duration, DTR
and hydrological quantities, and are often in line with aerosol emission
patterns. Over some remote land areas and over the oceans, confidence
is low owing to the lack of direct observations, which hamper a
truly global assessment. Satellite-derived SSR fluxes support the existence
of brightening also over oceans, but are less consistent over land
surface where direct aerosol effects become more important. There are
also indications for increasing downward thermal and net radiation
at terrestrial stations since the early 1990s with medium confidence.
Then there is section 7.3 that goes on for 28 pages that starts with this:
7.3 Aerosols
The section assesses the role of aerosols in the climate system, focusing
on aerosol processes and properties, as well as other factors, that
influence aerosol–radiation and aerosol–cloud interactions. Processes
directly relevant to aerosol–cloud interactions are discussed in Section
7.4, and estimates of aerosol RFs and ERFs are assessed in Section
7.5. The time evolution of aerosols and their forcings are discussed
in Chapters 2 and 8, with Chapter 8 also covering changes in natural
volcanic aerosols.
Here are the pertinent parts listed in the table of contents for chapter 7 to give you an idea of the subjects discussed:
7.3 Aerosols.............................................................................. 595
7.3.1 Aerosols in the Present-Day Climate System.............. 595
7.3.2 Aerosol Sources and Processes.................................. 599
7.3.3 Progress and Gaps in Understanding Climate Relevant Aerosol Properties....................................... 602
7.3.4 Aerosol–Radiation Interactions.................................. 604
7.3.5 Aerosol Responses to Climate Change and Feedback............................................................. 605
7.4 Aerosol–Cloud Interactions.......................................... 606
7.4.1 Introduction and Overview of Progress Since AR4..... 606
7.4.2 Microphysical Underpinnings of Aerosol–Cloud Interactions................................................................ 609
7.4.3 Forcing Associated with Adjustments in Liquid Clouds............................................................. 609
7.4.4 Adjustments in Cold Clouds....................................... 611
7.4.5 Synthesis on Aerosol–Cloud Interactions................... 612
7.4.6 Impact of Cosmic Rays on Aerosols and Clouds......... 613
7.5 Radiative Forcing and Effective Radiative Forcing by Anthropogenic Aerosols............................ 614
7.5.1 Introduction and Summary of AR4............................. 614
7.5.2 Estimates of Radiative Forcing and Effective Radiative Forcing from Aerosol–Radiation Interactions............. 614
7.5.3 Estimate of Effective Radiative Forcing from Combined Aerosol–Radiation and Aerosol–CloudInteractions................................................................ 618
7.5.4 Estimate of Effective Radiative Forcing from Aerosol–Cloud Interactions Alone............................................ 620

Looks to me like Lord of Planar and longview are both woefully ignorant of much of what the IPCC's AR5 says about aerosols.
 
And here is a summary from 2.3 concerning changes in radiation budgets:

Then there is section 7.3 that goes on for 28 pages that starts with this:

Here are the pertinent parts listed in the table of contents for chapter 7 to give you an idea of the subjects discussed:


Looks to me like Lord of Planar and longview are both woefully ignorant of much of what the IPCC's AR5 says about aerosols.
Except that the sections cited, support my argument, not yours, but without number attribution!
"In summary, the evidence for widespread multi-decadal variations in
solar radiation incident on land surfaces has been substantiated since
AR4, with many of the observational records showing a decline from
the 1950s to the 1980s (‘dimming’), and a partial recovery thereafter
(‘brightening’)."

The mentioned brightening since the 1980's is also during the period with the most observed warming.
AR5 only attributed a total forcing of forcing of -.82 W m-2 since 1750 to aerosol changes.
Peer reviewed publications show an increase in insolation, of between 1 and 4 W m-2 since the mid 1980's,
That is an enormous difference.
Enlightening Global Dimming and Brightening
"Literature estimates for the overall SSR decline during dimming range from 3 to 9 W m−2, and from 1 to 4 W m−2 for the partial recovery during subsequent brightening (Stanhill and Moreshet 1992; Liepert et al. 1994; Abakumova et al. 1996; Gilgen et al. 1998; Stanhill and Cohen 2001; Alpert et al. 2005; Kvalevag and Myhre 2007; Kim and Ramanathan 2008; Wild 2009) (Fig. 1), with more likely values closer to the lower bound because of pos-sible inherent urbanization effects (Alpert et al. 2005; Kvalevag and Myhre 2007) (see below). "
Increases in Surface Solar Radiation (SSR) are part of EEI!
 
To which my response is: So what?


Well, I know that. Your disingenuity, misrepresentation and deception make that rather apparent. See you on another thread.
 
Back
Top Bottom