- Joined
- Mar 31, 2013
- Messages
- 63,561
- Reaction score
- 28,937
- Gender
- Male
- Political Leaning
- Undisclosed
Ok, I’ll do it your way.The estimate is from your own un cited posted graph!
Ill just claim they all agree without bothering to back up my claim.

Ok, I’ll do it your way.The estimate is from your own un cited posted graph!
Anyone with eyes can see from your graph that the 4 data sets listed, end in range of temperatures.Ok, I’ll do it your way.
Ill just claim they all agree without bothering to back up my claim.
I’m glad I could supply actual data for you to look at.Anyone with eyes can see from your graph that the 4 data sets listed, end in range of temperatures.
But your supplied data supported my point that the data sets do not agree, but produce a range of temperaturesI’m glad I could supply actual data for you to look at.


You are trying too hard, a clear sign of having no solid ground to stand on.The “Warmest September Ever” Is A Myth… Cooler Times Likely Ahead As NASA Foresees Strong La Nina…
By P Gosselin on 9. October 2020
Share this...
Our friend “SnowFan” here looks at the claims that September 2020 was the warmest ever recorded. It turns out that other measurement advanced satellites don’t agree.
According to the much ballyhooed data, temperatures in Europe in September this year were on average 0.2 degrees Celsius higher than in the previous record September 2018. The service providing the data is part of the European earth observation program Copernicus.
But the satellite data from the UAH and RSS both agree that this is not really the case!
Above the global satellite data from UAH (left) and from RSS (right) in the tables clearly clearly show the monthly deviations from the WMO mean 1981-2010 (UAH) and from the climate mean 1979-1998 (RSS): September 2020 was not the warmest since satellite measurements began in 1979. At UAH, September 2019 was slightly warmer while at RSS even September 2017 was warmer.
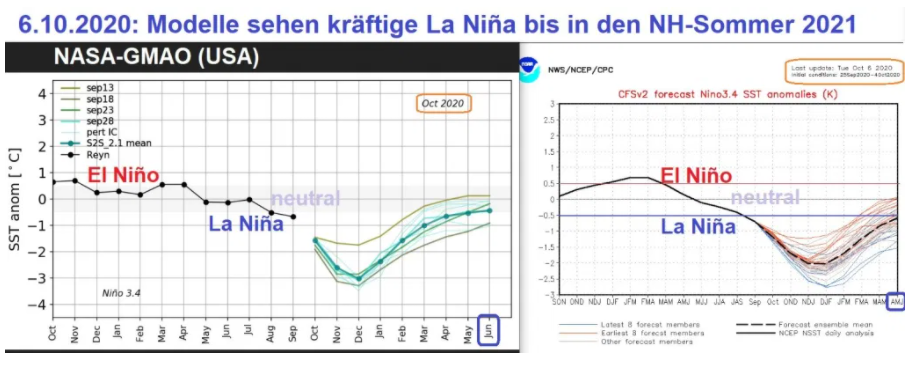
Strong La Nina may be in the works
Overall the globe’s surface continues to cool since the peak of the 2015/16 El Nino, and that cooling will very likely continue if NASA and the US National Weather Service projections are correct. Both Agencies see a significant La Nina in the pipeline for 2021.
The current ENSO forecasts of NASA (left) and NOAA (right) from October 6, 2020, predict an unusually strong La Niña in the equatorial Pacific with temperature deviations down to -3°C and with unusually long duration until the NH summer of 2021.
Such a strong event would certainly lead remarkable surface cooling. Source: BOM ENSO models with additions.
All I have are the data.You are trying too hard, a clear sign of having no solid ground to stand on.
It probably should, but several factors may prevent it from being cooler.
Our poor understanding of the climate cycles could produce a Bessel function secondary peak,

or Anthropogenic adjustments by zealots, could both produce a slightly warmer 2020, than 2016.

 www.weforum.org
 www.beforetheflood.com
Who is making baseless claims? I simply said that the climate moves in cycles, andYou baseless claim that the world's leading scientists are zealots that fiddle with the data is ridiculous in itself. But it becomes even more ridiculous considering that for example NASA that predicts that 2020 will be the warmest year on record is in under control of a president that denies the urgent need for action and also Republicans like James Inhofe.
2020 is predicted to be the hottest year on record, according to NASA
Scientists at NOAA are already projecting that 2020 will end up being the hottest year ever recorded.
"Senator James Inhofe (R-OK) is the chairman of the Senate Committee on Environment and Public Works. According to Oil Change International, Inhofe has received over $2 million in political contributions from the fossil fuel industry. He once compared the Environmental Protection Agency to the Gestapo, and brought a snowball onto the Senate floor to ‘disprove’ global warming. Sen. Inhofe, author of the 2012 book The Greatest Hoax: How the Global Warming Conspiracy Threatens Your Future, once claimed on the Senate floor that “man-made global warming is the greatest hoax ever perpetrated on the American people.”"
Top 11 Climate Deniers: Key Players Revealed - Before The Flood
Unmask the top climate change deniers who are influencing public opinion and policy. This article sheds light on the individuals and organizations that have played significant roles in climate disinformation.
Who is making baseless claims? I simply said that the climate moves in cycles, and
interfering cycles, produce maxima and minima functions.
No one disagrees on this!
Why would you think that constructive interference maxima's would have to be lower than earlier maxima's?Yes so that it's even more alarming that 2020 can become the warmest year of record without being an El Nino year.
Also you made this claim: "Anthropogenic adjustments by zealots, could both produce a slightly warmer 2020, than 2016". Without any evidence also as I pointed out that those federal agencies are under the control and scrutiny of Republicans that deniers the urgent need for action.
Why would you think that constructive interference maxima's would have to be lower than earlier maxima's?
It depends on the phase of the other cycles included.
For all we know, one of the cycles for be the warming phase of a 70 year cycle, with some actual AGW warming on top.
We warmed from 1910 to 1945, cooled from 1945 to 1979. and warmed from 1979 to 2014.
Throw in some actual AGW warming and a 2016 strong El Nino, and it is entirely possible that
2020 could be as warm as 2016.
Do you really want to claim that adjustments made by Humans are NOT Anthropogenic?
Actually I showed a defined cycle of 70 years, that what that description was.You have provided no evidence for that their are any cycles that would lead to that 2020 should be a warmer yeas. Instead 2020 is not an El Nino year and still can become warmer than 2016 that was a strong El Nino years.
You made this claim: "Anthropogenic adjustments by zealots, could both produce a slightly warmer 2020, than 2016" implying that scientists would fudging the data. That claim is ridiculous in itself but becomes even more ridiculous considering that those scientists are under the control and scrutiny by Republican politicians that denies the urgent need for action.
Actually I showed a defined cycle of 70 years, that what that description was.
" We warmed from 1910 to 1945, cooled from 1945 to 1979. and warmed from 1979 to 2014. "
Read up on the nyquist theorem, it will help you understand what a cycle is.

 www.climatecentral.org
Pick any of the data sets you want, they all show the same cycle,What is the source? Also the warmest year on record have been since you claimed warming period between 1979 2014.
Top 10 Warmest Years on Record
The global numbers are in, and 2019 ranks as the 2nd hottest year on record
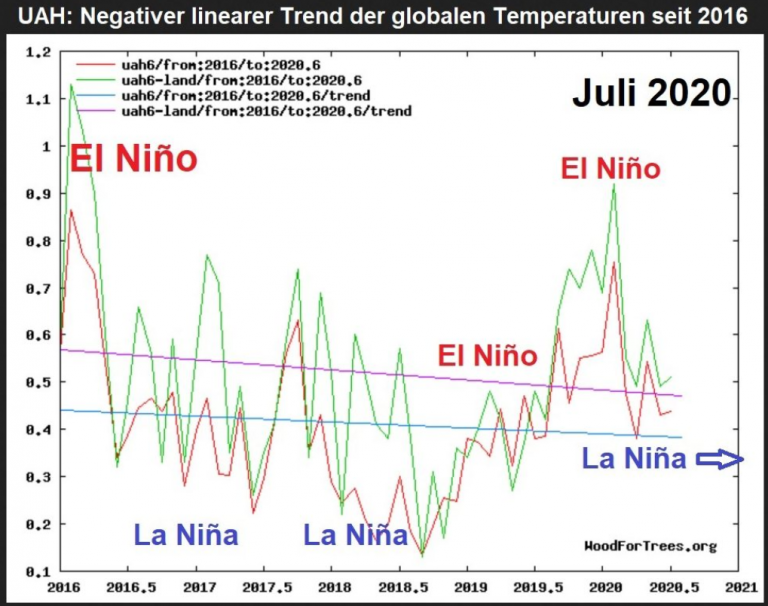
Pick any of the data sets you want, they all show the same cycle,
"warmed from 1910 to 1945, cooled from 1945 to 1979. and warmed from 1979 to 2014."
Wood for Trees
2016 was an El Nino year, and would completely disrupt any underlying pattern.
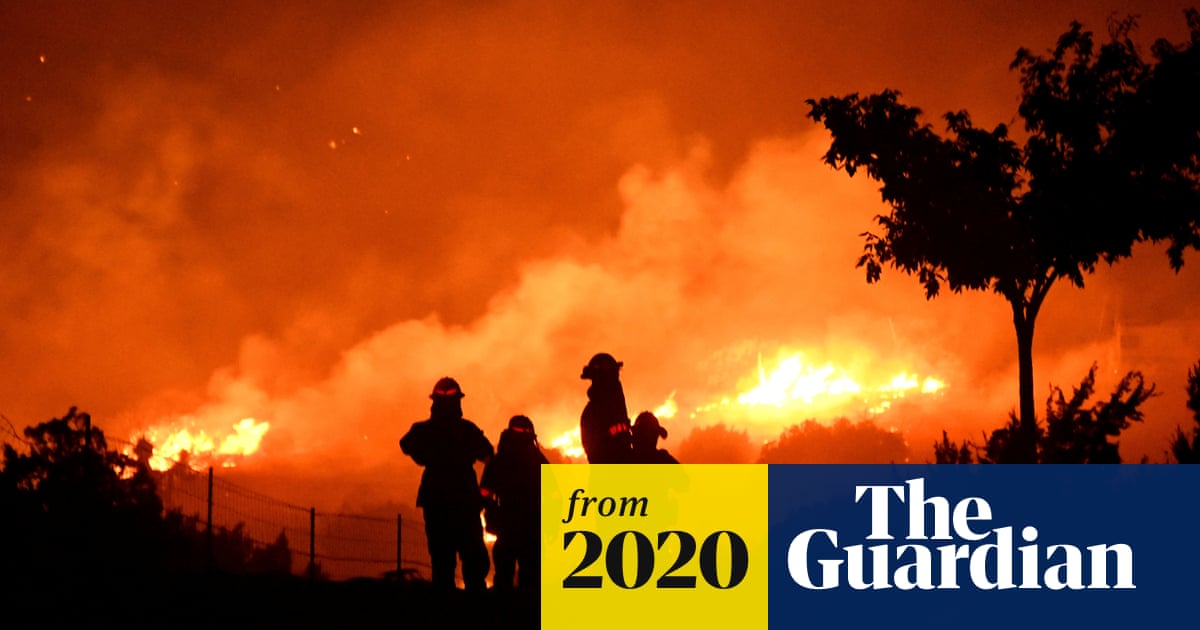
 www.theguardian.com
Cooling is relative! The average temperature did decrease slightly between 1943 and 1977, butYou own graph show that there was no "cooling period" instead you just had a temporary slow down on the continuance trend of warmer temperatures. Because of increase air pollution. You graph show a trend of increasing temperature and as I all the warmest year on record have been since 2014.
Cooling is relative! The average temperature did decrease slightly between 1943 and 1977, but
we were in a general warming trend since the end of the little ice age.
In a warming trend, why would you not expect the more recent temperatures to be the warmest?
What I am talking about is the period of a cycle of roughly 70 years.
You cannot just ignore the cycle and choose a single phase to represent the entire event!
Read first! The "little ice age" ended around 1850.The last ice age was thousands a year ago. So why would it suddenly be a sharp increase in temperature because of it now?
That it's overwhelming evidence that the recent warming is caused by the release of greenhouse gases.
"The current warming trend is of particular significance because most of it is extremely likely (greater than 95% probability) to be the result of human activity since the mid-20th century and proceeding at a rate that is unprecedented over decades to millennia.1
Earth-orbiting satellites and other technological advances have enabled scientists to see the big picture, collecting many different types of information about our planet and its climate on a global scale. This body of data, collected over many years, reveals the signals of a changing climate.
The heat-trapping nature of carbon dioxide and other gases was demonstrated in the mid-19th century.2 Their ability to affect the transfer of infrared energy through the atmosphere is the scientific basis of many instruments flown by NASA. There is no question that increased levels of greenhouse gases must cause Earth to warm in response.
Ice cores drawn from Greenland, Antarctica, and tropical mountain glaciers show that Earth’s climate responds to changes in greenhouse gas levels. Ancient evidence can also be found in tree rings, ocean sediments, coral reefs, and layers of sedimentary rocks. This ancient, or paleoclimate, evidence reveals that current warming is occurring roughly ten times faster than the average rate of ice-age-recovery warming. Carbon dioxide from human activity is increasing more than 250 times faster than it did from natural sources after the last Ice Age.3"
Evidence - NASA Science
Takeaways The rate of change since the mid-20th century is unprecedented over millennia. Earth’s climate has changed throughout history. Just in the last 800,000 years, there have been eight cycles of ice ages and warmer periods, with the end of the last ice age about 11,700 years ago marking...climate.nasa.gov
Read first! The "little ice age" ended around 1850.
Little ice age
Even a zealot source like skeptical science shows increases coming out of the little ice age,
they conveniently discontinue the carbon 14, insolation proxy in 1950.
What ended the little ice age
"The carbon-14 data used in this graph go up to 1950. The graph below gives a fuller picture,
showing that in the last three decades, the sun's normal cycle of activity has remained steady, while temperatures have shot up:"
Notice that they switched from a proxy that shows sunlight reaching the ground (Trees uptake of carbon 14),
to measuring the sunlight reaching the top of the atmosphere.
I will see if I can find the continuation of the carbon 14 proxy series.

Perhaps, perhaps not! Your graphical temperature history, uses proxies for the temperature, with limited resolution.Both the Medieval Warm Period and Little Ice Age had small temperature changes compared to rapid temperature increase we are now seeing,
View attachment 67301233
2019 years | Climate Lab Book
www.climate-lab-book.ac.uk
The levels of carbon 14 are not affected by how much sunlight reaches the ground. It is affected by cosmic rays hitting the upper troposphere and stratosphere. https://en.wikipedia.org/wiki/Carbon-14Read first! The "little ice age" ended around 1850.
Little ice age
Even a zealot source like skeptical science shows increases coming out of the little ice age,
they conveniently discontinue the carbon 14, insolation proxy in 1950.
What ended the little ice age
"The carbon-14 data used in this graph go up to 1950. The graph below gives a fuller picture,
showing that in the last three decades, the sun's normal cycle of activity has remained steady, while temperatures have shot up:"
Notice that they switched from a proxy that shows sunlight reaching the ground (Trees uptake of carbon 14),
to measuring the sunlight reaching the top of the atmosphere.
I will see if I can find the continuation of the carbon 14 proxy series.
Yes we are rounding the corner Jack. Warming will go away like a miracle. Right?2020 will mark the resumption of cooling.

Not a miracle. Solar/GCR-driven climate.Yes we are rounding the corner Jack. Warming will go away like a miracle. Right?