- Joined
- Mar 31, 2013
- Messages
- 67,290
- Reaction score
- 33,978
- Gender
- Male
- Political Leaning
- Undisclosed
Weird that you cling to one publication, and ignore more recent ones that are published in more reputable journals- including one in June, 202I am not ignoring what is declining,
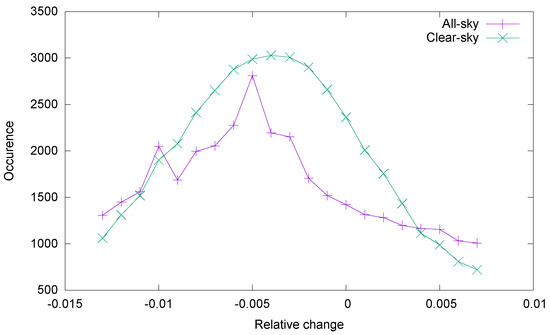
Decadal Changes of the Reflected Solar Radiation and the Earth Energy Imbalance
Both the EEI from the CERIS satellite, and the Ocean Heat Content Time Derivative show that Earth's energy imbalance is declining.
By the way has Gavin made any predictions for 2021 without the help from an El Nino event?
Giss does not have 2021 looking like a warm year so far.
Jan -.36C, Feb -.6C, March -.29C, April -.38C, May -.22C
oh wait. Not weird. Typical.