
- Joined
- Jan 28, 2013
- Messages
- 94,823
- Reaction score
- 28,343
- Location
- Williamsburg, Virginia
- Gender
- Male
- Political Leaning
- Independent
Here is a research result that crashes right into AGW climate orthodoxy. As the narrative highlights, inconvenient results have been "disappeared" before, but this time may be more difficult.
[h=2]Unsettled: Scientists Find Ocean Heat Change Rate And Earth’s Energy Imbalance In DECLINE Since 2000[/h]By Kenneth Richard on 2. January 2020
[h=4]According to a new paper, the Earth’s ocean heat content time derivative (OHCTD) has been decreasing (-0.26 W/m²/decade) since 2000, coinciding with a similar deficit in the Earth’s energy imbalance (EEI). The authors acknowledge such trends are “surprising” considering greenhouse gas emissions have risen.[/h]
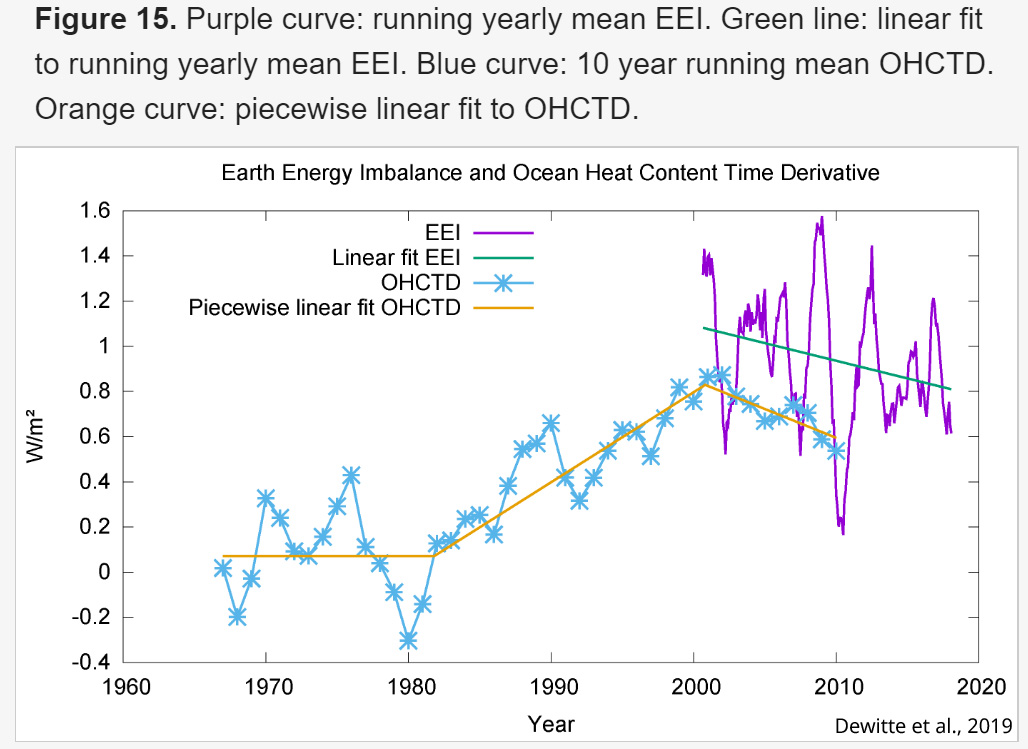
[h=6]Image Source: Dewitte et al., 2019[/h][h=4]Earth’s energy budget imbalanced?[/h]Global warming occurs when there is more energy coming in to the climate system than leaving. This results in a positive imbalance in the Earth’s energy budget.
Most studies claim the imbalance has been about +0.6 W/m² since the 2000s (Stephens et al., 2012, Llovel et al., 2013), although the uncertainty in the surface energy imbalance estimate reaches ±17 W/m² (Stephens et al., 2012). Uncertainty in the Earth’s energy imbalance is therefore more than 100 times larger than the total accumulated forcing for CO2 over a 10-year period (+0.2 W/m², Feldman et al., 2015).
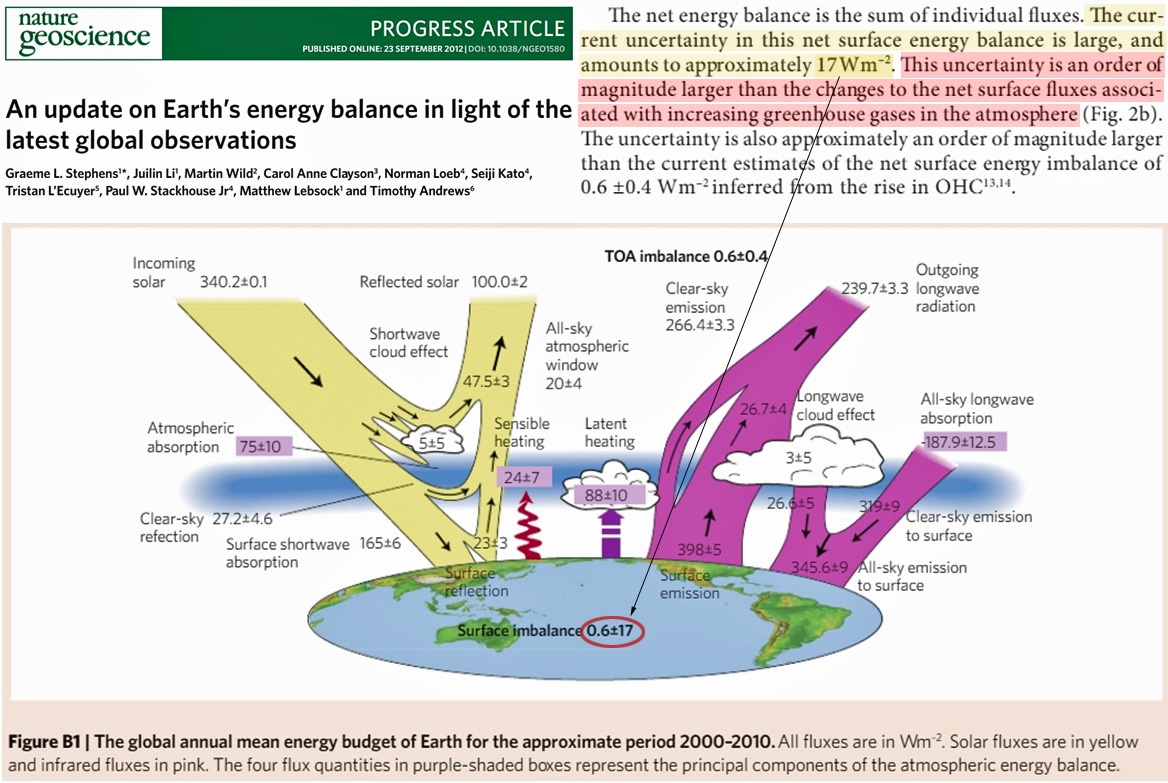
[h=6]Image Source: Stephens et al., 2012[/h][h=4]A cooling global ocean?[/h]Per the IPCC, 93% of “global warming” is manifested by rising trends in 0-2000 m ocean heat content (OHC) (IPCC AR5, Chapter 3).
In 2006 scientists published a paper in Geophysical Research Letters asserting global OHC had rapidly declined from 2003 to 2005.
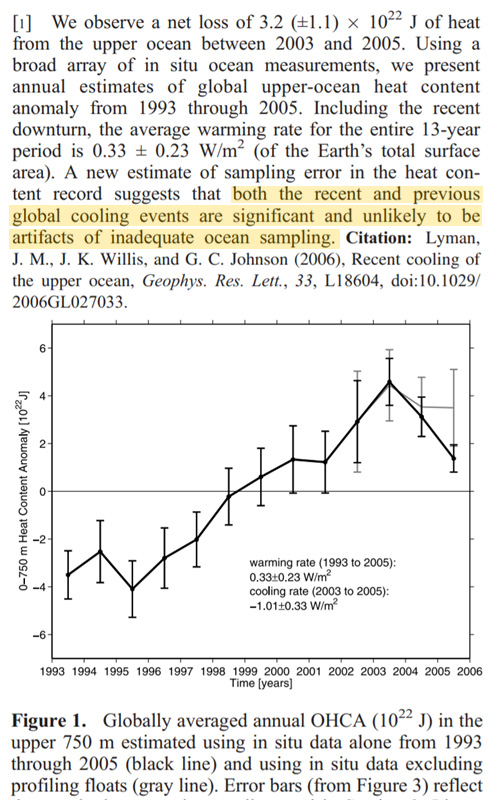
[h=6]Image Source: Lyman et al., 2006[/h][h=4]Cooling must be corrected to show warming[/h]Of course, a cooling ocean does not conform with climate models predicating ocean heat content should rise in tandem with CO2 emissions.
So the overseers of ocean heat content datasets set out to find a way to “correct” the data. . . . . [Read the link for details.]
New paper: Earth’s energy imbalance in deficit since 2000
A new data analysis authored by three Belgian scientists (Dewitte et al., 2019) finds not only has there been more heat energy leaving than accumulating in the Earth’s climate system this century, but ocean heat content time derivative (OHCTD) has likewise been declining since the early 2000s.
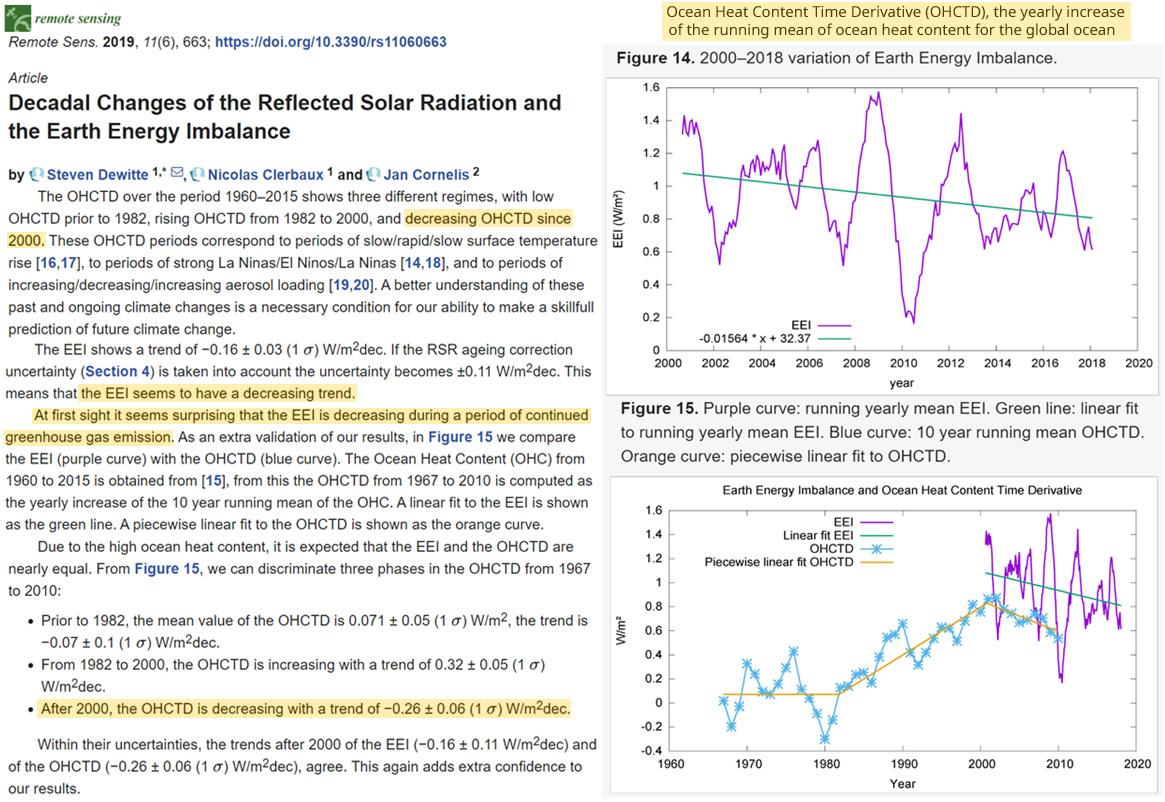
[h=6]Image Source: Dewitte et al., 2019[/h]The authors assessed the trends in OHCTD during 1960-2015. They found that although there was a rising trend from 1982 to 2000, since 2000 the OHCTD trend has been decreasing at a rate of -0.26 W/m² per decade.
Compatibly, Dewitte and co-authors also determined there has been a deficit (-0.16 ±0.11 W/m² per decade) in the Earth’s energy imbalance (EEI) from 2000-2018.
The scientists acknowledge that these trends may seem “surprising” at first given the sharp rise in greenhouse gas emissions in recent decades. But they find the agreement between the recent OHCTD and EEI trends “adds extra confidence” to their results.
Expect these results to be “corrected” by the data overseers in due time.
[h=2]Unsettled: Scientists Find Ocean Heat Change Rate And Earth’s Energy Imbalance In DECLINE Since 2000[/h]By Kenneth Richard on 2. January 2020
[h=4]According to a new paper, the Earth’s ocean heat content time derivative (OHCTD) has been decreasing (-0.26 W/m²/decade) since 2000, coinciding with a similar deficit in the Earth’s energy imbalance (EEI). The authors acknowledge such trends are “surprising” considering greenhouse gas emissions have risen.[/h]
[h=6]Image Source: Dewitte et al., 2019[/h][h=4]Earth’s energy budget imbalanced?[/h]Global warming occurs when there is more energy coming in to the climate system than leaving. This results in a positive imbalance in the Earth’s energy budget.
Most studies claim the imbalance has been about +0.6 W/m² since the 2000s (Stephens et al., 2012, Llovel et al., 2013), although the uncertainty in the surface energy imbalance estimate reaches ±17 W/m² (Stephens et al., 2012). Uncertainty in the Earth’s energy imbalance is therefore more than 100 times larger than the total accumulated forcing for CO2 over a 10-year period (+0.2 W/m², Feldman et al., 2015).
[h=6]Image Source: Stephens et al., 2012[/h][h=4]A cooling global ocean?[/h]Per the IPCC, 93% of “global warming” is manifested by rising trends in 0-2000 m ocean heat content (OHC) (IPCC AR5, Chapter 3).
In 2006 scientists published a paper in Geophysical Research Letters asserting global OHC had rapidly declined from 2003 to 2005.
[h=6]Image Source: Lyman et al., 2006[/h][h=4]Cooling must be corrected to show warming[/h]Of course, a cooling ocean does not conform with climate models predicating ocean heat content should rise in tandem with CO2 emissions.
So the overseers of ocean heat content datasets set out to find a way to “correct” the data. . . . . [Read the link for details.]
New paper: Earth’s energy imbalance in deficit since 2000
A new data analysis authored by three Belgian scientists (Dewitte et al., 2019) finds not only has there been more heat energy leaving than accumulating in the Earth’s climate system this century, but ocean heat content time derivative (OHCTD) has likewise been declining since the early 2000s.
[h=6]Image Source: Dewitte et al., 2019[/h]The authors assessed the trends in OHCTD during 1960-2015. They found that although there was a rising trend from 1982 to 2000, since 2000 the OHCTD trend has been decreasing at a rate of -0.26 W/m² per decade.
Compatibly, Dewitte and co-authors also determined there has been a deficit (-0.16 ±0.11 W/m² per decade) in the Earth’s energy imbalance (EEI) from 2000-2018.
The scientists acknowledge that these trends may seem “surprising” at first given the sharp rise in greenhouse gas emissions in recent decades. But they find the agreement between the recent OHCTD and EEI trends “adds extra confidence” to their results.
Expect these results to be “corrected” by the data overseers in due time.
