- Joined
- Nov 18, 2016
- Messages
- 62,589
- Reaction score
- 39,646
- Gender
- Male
- Political Leaning
- Liberal
But you guys don't offer any proof. All you guys do is antagonize. Typical bullies.
What proof counts. Your layman’s analysis?

But you guys don't offer any proof. All you guys do is antagonize. Typical bullies.
What proof counts. Your layman’s analysis?
Actual peer reviewed papers with applicable quotes instead of what some blogger or journalist said.
What about direct quotes from actual scientists?
This Was the Decade We Knew We Were Right - Scientific American Blog Network
Oh, right.
They don’t ‘understand the climate sciences’ as well as you.
I saw an "As climate scientist Alex Hall puts it" but I didn't see any actual quotes, in context.
Care to find them for me so I don't wast my time reading garbage?
I saw an "As climate scientist Alex Hall puts it" but I didn't see any actual quotes, in context.
Care to find them for me so I don't wast my time reading garbage?
Kate Marvel
Kate Marvel is a climate scientist at Columbia University and the NASA Goddard Institute for Space Studies. She received a PhD in theoretical physics from Cambridge University and has worked at Stanford University, the Carnegie Institution, and Lawrence Livermore National Laboratory. Her writing has appeared in Scientific American, On Being, and Nautilus Magazine, and she's given talks in places as diverse as comedy clubs, prisons, and the TED main stage.
The climate scientist, Kate Marvel, is the writer.
It doesn't matter. For example, I like the papers that James Hansen writes. He leaves his activism out of them and accurately writes what he knows, doesn't know, and suspects. However, outside of published works, he will make claims he doesn't in his professional works.
Judith Curry is a respected climate scientist. We know your take. She is not part of your religious cult, so you deny her science.
Oh...
I've been listening to the hour YouTube linked. I like him. He is relating real threats to coral for example instead of climate change for example. I'm just over 24 minutes into it so far.
I like what most the scientists say. Just now how they are portrayed by media lies.
Oh. So you want to hear from scientists, but not the ones that don’t agree with you.
No, I want to read what they are willing to commit their reputation to in science papers. Not what they claim in an environment they don't risk their reputation.
Like writing for scientific American?
LOL
Actual peer reviewed papers with applicable quotes instead of what some blogger or journalist said.
"Here, we update this term using currently available spatial distributions of source data, state‐of‐the‐art reanalyses, and incorporate independently derived estimates for ocean data processing, station homogenization, and other structural biases. The resulting 95% uncertainties are near 0.05 °C in the global annual mean for the last 50 years and increase going back further in time reaching 0.15 °C in 1880. In addition, we quantify the benefits and inherent uncertainty due to the GISTEMP interpolation and averaging method. We use the total uncertainties to estimate the probability for each record year in the GISTEMP to actually be the true record year (to that date) and conclude with 86% likelihood that 2016 was indeed the hottest year of the instrumental period (so far)."
Error - Cookies Turned Off
It depends on if they balance all the facts, or just focus on the popular targets.
When they speak of a topic, and don't address all variables, they are suspect. Surely they know better. Listening to Alex Hall, he is covering all bases. He is covering what your religious cult speaks of, but he is also covering the sciences you guys deny.
Unsettled: Scientists Find Ocean Heat Change Rate And Earth’s Energy Imbalance In DECLINE Since 2000
By Kenneth Richard on 2. January 2020
According to a new paper, the Earth’s ocean heat content time derivative (OHCTD) has been decreasing (-0.26 W/m²/decade) since 2000, coinciding with a similar deficit in the Earth’s energy imbalance (EEI). The authors acknowledge such trends are “surprising” considering greenhouse gas emissions have risen.
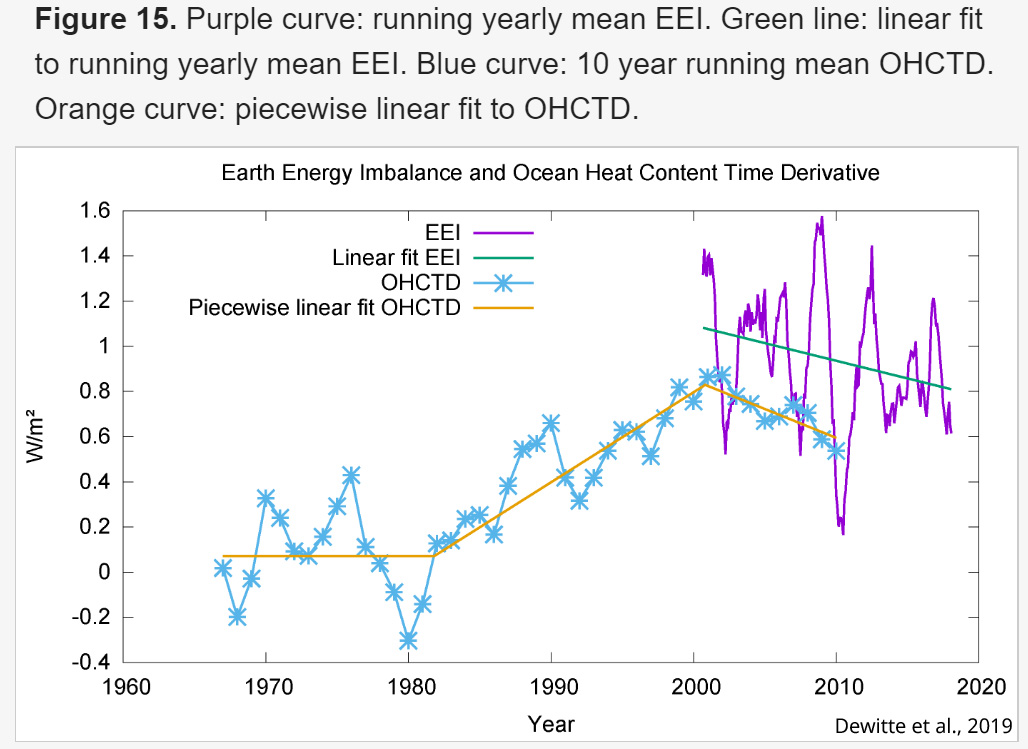
Image Source: Dewitte et al., 2019
Earth’s energy budget imbalanced?
Global warming occurs when there is more energy coming in to the climate system than leaving. This results in a positive imbalance in the Earth’s energy budget.
Most studies claim the imbalance has been about +0.6 W/m² since the 2000s (Stephens et al., 2012, Llovel et al., 2013), although the uncertainty in the surface energy imbalance estimate reaches ±17 W/m² (Stephens et al., 2012). Uncertainty in the Earth’s energy imbalance is therefore more than 100 times larger than the total accumulated forcing for CO2 over a 10-year period (+0.2 W/m², Feldman et al., 2015).
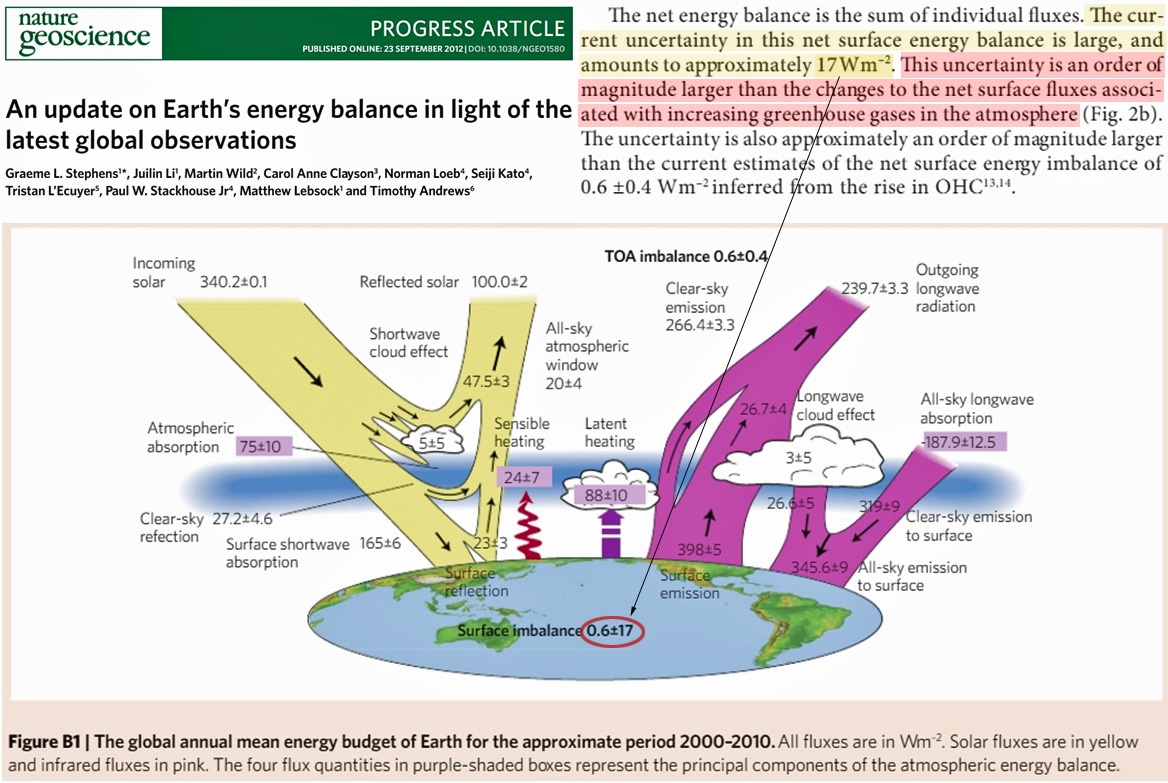
Image Source: Stephens et al., 2012
. . . .
I'm freezing. I'm going to buy another blanket.
It depends on if they balance all the facts, or just focus on the popular targets.
When they speak of a topic, and don't address all variables, they are suspect. Surely they know better. Listening to Alex Hall, he is covering all bases. He is covering what your religious cult speaks of, but he is also covering the sciences you guys deny.
Oh and I feel great. It must mean all those doctors telling me I may have metastatic cancer are wrong. Right? (I don't have cancer, BTW- just making a point).
Yes, that I should stop responding to people like you.
Lord of Planar said:You have no intention of a rational debate.
Lord of Planar said:All you want to do is piss me off.
But you guys don't offer any proof.
Lord of Planar said:All you guys do is antagonize. Typical bullies.
[h=2]Report Cards[/h] Find each watershed’s report card
- Columbia Slough Report Card
- Fanno Creek Report Card
- Johnson Creek Report Card
- Tryon Creek Report Card
- Willamette (Mainstem) Report Card
- Willamette River Tributaries Report Card
The info is listed as "Effective impervious area".
Buzz put this in another thread, it is better for me to respond here though.
These are not very meaningful for his argument. The first link is the only area in Portland. The others are outside of Portland or only partial in Portland. The Columbia Slough Report Card refers to another link speaking of 600 acres of runoff caused by development being diverted to a wetland. Well, 600 acres of over 85,000 acres of city land, is just 0.7%. This link represents on;y 0.7% of Portland's area rainwater being sent to a useful area. Like I said before, projects are insignificant. What is funny, his links support my contentions more than his. At the same time, that link says:
Land area in the Columbia Slough watershed is highly developed with roads, homes, businesses, industries and port facilities, leading to poor overall habitat scores. However, the watershed also has significant habitat resources that are protected as natural areas. Smith and Bybee Wetlands, Vanport Wetlands and Big Four Corners Natural Area are examples.
The poor riparian score is due to the history of development right up to the slough banks leaving little to no buffer of plants and trees. The Watershed Revegetation Program’s work with private property owners over the last two decades has had a positive impact, but additional efforts are needed.
The Fanno Creek link:
Stream connectivity is poor because culverts and piped streams interfere with natural drainage. About 4.7 miles of Fanno Creek and its tributaries in Portland flow through pipes. The City works to bring portions of streams back to the surface when possible.
---
Stormwater runoff is a significant cause of water quality problems in this watershed. Silt and sediment from roads, development, and channel erosion contribute to high levels of total suspended solids (TSS). Copper from vehicle brake pads is a common pollutant in stormwater. Stream temperatures increase in summer and exceed water quality standards necessary for salmon rearing. Adding more green street planters and other ways for water to soak into the ground is one solution to reduce stream temperatures.
The creek effectively no longer exists in Portland. It comes from the Tigard area, if my memory serves me right. In pipes under Portland to the Wilmette river.
Stormwater runoff...
Water that in the past, would mostly be sequestered by uncapped land, and not contaminated.
Tryon Creek:
Hard surfaces like roads, rooftops, and parking lots in this watershed create a lot of stormwater runoff when it rains. Stormwater makes stream banks unstable, causes erosion, and deposits sediment in streambeds. Runoff from Interstate 5, SW Barbur Boulevard, and other streets carries pollutants into streams. Stormwater management projects at the Oregon Department of Transportation Baldock Maintenance Yard, the Barbur Boulevard Park and Ride and I-5 at SW 26th that manage runoff from nearly 30 acres, but more work is needed to improve the scores.
About 30 miles of streams flow through the watershed of which about three miles are in pipes. Environmental Services continues to plan projects in this area to restore stream conditions, including bringing some of those piped streams back to the surface.
Willamette Mainstream:
In Portland, parking lots, roofs and streets prevent rain from soaking into the ground and recharging groundwater supplies.
Lord of Planar said:And he still hasn't linked me his imaginary 25% to 66% number.
My God man. I addressed this. This is my number and said it might be less. Why won't you stop? Are you insane?Show me where any of this backs up your assertion that Portland is 90% covered. There isn't anything.
I don't see that anyplace. It isn't in the links you provided. Besides, a watershed is not the whole of Portland. Like I pointed out, the 600 acres was only about 0.7% of Portland.The post you just quoted has the links to the data. I am sorry that it isn't a form that is easily quotable or in percentages.
I guess you do need to be spoon-fed:
Columbia Slough - 52% covered
Johnson Creek - 15% covered
Willamette (Mainstem) - 59% covered
Fanno Creek - 57% covered
Tryon Creek - 47% covered
Willamette River Tributaries - 59% covered
Note: this is new and recently updated data. So the data has changed from when I first estimated Portland's coverage. And these numbers only apply to the portion of the watershed within Portland's city limits.
The post you just quoted has the links to the data. I am sorry that it isn't a form that is easily quotable or in percentages.
I guess you do need to be spoon-fed:
Columbia Slough - 52% covered
Johnson Creek - 15% covered
Willamette (Mainstem) - 59% covered
Fanno Creek - 57% covered
Tryon Creek - 47% covered
Willamette River Tributaries - 59% covered
")