• This is a political forum that is non-biased/non-partisan and treats every person's position on topics equally. This debate forum is not aligned to any political party. In today's politics, many ideas are split between and even within all the political parties. Often we find ourselves agreeing on one platform but some topics break our mold. We are here to discuss them in a civil political debate. If this is your first visit to our political forums, be sure to check out the RULES. Registering for debate politics is necessary before posting. Register today to participate - it's free!

Foundation of a New Climate Paradigm

New Study Finds Robust Statistical Probability Temperature Drives CO2 Changes, Upending ‘Scientific Perception’
By Kenneth Richard on 5. October 2020

Share this...
Share on FacebookTweet about this on Twitter
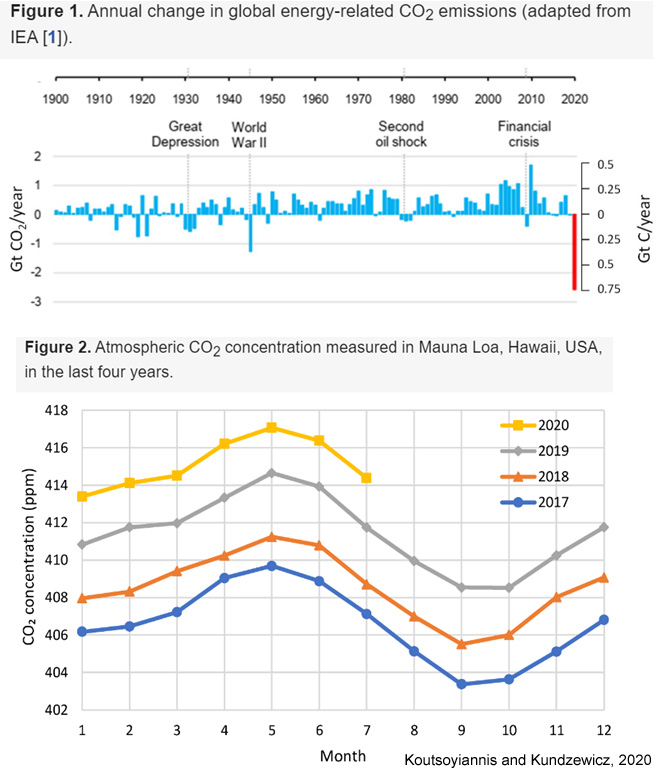
Prompted by the observation that dramatic COVID-related reductions in 2020 human CO2 emissions had zero impact on the Earth’s CO2 concentration, two scientists conduct extensive statistical probability analyses to conclude temperature changes lead CO2 changes, not the other way around.
The nearly global acceptance of economically-devastating lockdowns as a mitigating response to the COVID-19 pandemic has inspired many to question the assumption humans drive changes in CO2 concentration.
As Drs. Koutsoyiannis and Kundzewicz point out in their iconoclastic new study, “despite unprecedented decrease in carbon emission, there was an increase in atmospheric CO2 concentration, which followed a pattern similar to previous years.”
CO2-emissions-do-not-align-with-Mauna-Loa-Koutsoyiannis-and-Kundzewicz-2020.jpg

Image Source: Koutsoyiannis and Kundzewicz, 2020
Utilizing the obvious condition that causes precede effects, or that effects do not lead causes, the authors first point out that the paleoclimate record shows CO2 changes follow temperature changes by about 1000 years. Then they examine the sequential relationship between global temperature and atmospheric CO2 concentration during 1980–2019.
While they find the causality direction for CO2 leading temperature (T) changes does exist, the results of their study clearly “support the hypothesis that the dominant direction is T → CO2,” not CO2 → T.
In fact, the statistical probability is so robust “the p-values in the direction T → [CO2] are always smaller than in direction [CO2] → T by about 4 to 5 orders of magnitude, thus clearly supporting T → [CO2] as dominant direction.” Temperature is shown to lead CO2 changes by about 6 months to a year. . . .
 
Solar
New prediction of Solar Cycle 25
Prediction of Solar Cycle 25 Leif Svalgaard1* 1W.W. Hansen Experimental Physics Laboratory, Stanford University Cypress Hall, C3, 466 Via Ortega, Stanford, CA 94305-4085 *Corresponding author: Leif Svalgaard (leif@leif.org) ABSTRACT Prediction of solar cycle is an important goal of Solar Physics both because it serves as a touchstone for our understanding of the sun and also…
 
Cooler temperatures, are much more concerning than warmer temperatures, and the potential
amount of the effect is much greater.
 
Solar
A new look at sunspots
NASA’s extensive fleet of spacecraft allows scientists to study the Sun extremely close-up – one of the agency’s spacecraft is even on its way to fly through the Sun’s outer atmosphere. But sometimes taking a step back can provide new insight.
 
New Study Finds A Robust Link Between European Temperatures And Solar Activity Via AMO/NAO Modulation
By Kenneth Richard on 22. October 2020

Share this...
Share on FacebookTweet about this on Twitter
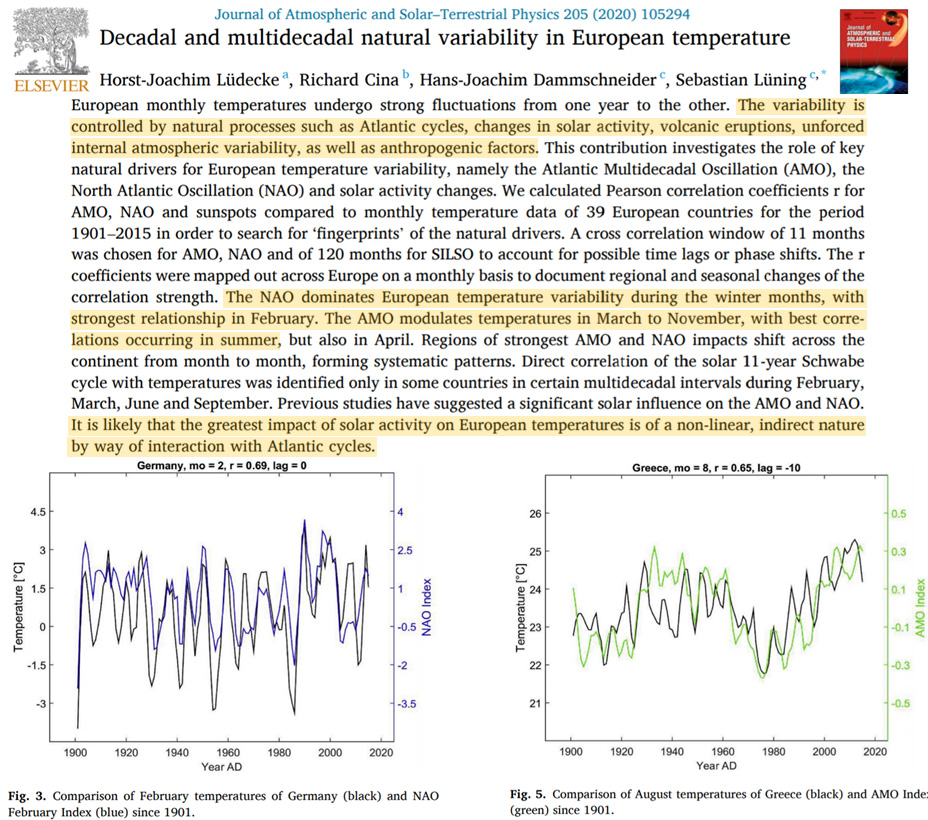
European winter temperature variability is “dominated” by the North Atlantic Oscillation (NAO), which is, in turn, modulated by solar activity.
Even proponents of anthropogenic global warming (AGW) agree natural processes (AMO, NAO, ENSO, solar forcing, volcanism) drive temperature variability. But they insist the rising temperature trend is human-caused.
So if we don’t have a regional upward trend, is the non-warming natural or anthropogenic?
Lüdecke et al., 2020 find temperatures across Europe have been oscillating, not rising in linear fashion, for the last century. The timings of the temperature undulations correspond quite closely to natural ocean cycles (the NAO and AMO). The authors detail a non-linear and indirect solar activity impact on these ocean cycles, and ultimately to the European climate.
NAO-AMO-and-solar-activity-drive-European-temp-variability-Ludecke-2020.jpg

Image Source: Lüdecke et al., 2020
 

Study suggests no more CO2 warming
Precision research by physicists William Happer and William van Wijngaarden has determined that the present levels of atmospheric carbon dioxide and water vapor are almost completely saturated. In radiation physics the technical term “saturated” implies that adding more molecules will not cause more warming.
Continue reading →
 
CO2 off its pedestal.

New Study Finds CO2 Reached 1980s-2000s Levels About 4,000 Years Ago In Japan
By Kenneth Richard on 23. November 2020

Share this...
Share on FacebookTweet about this on Twitter
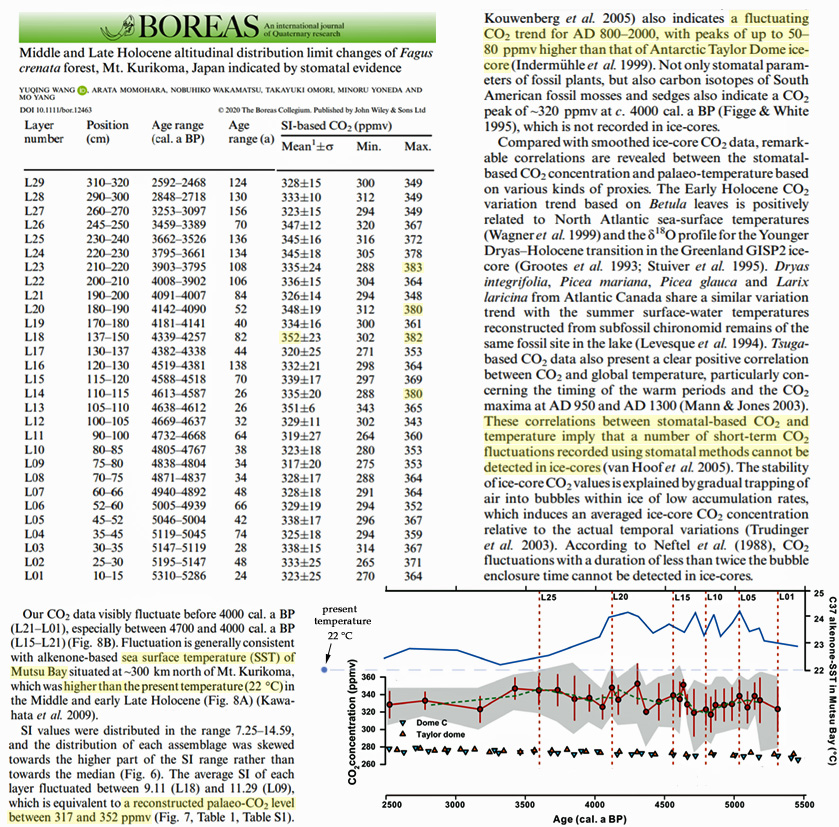
CO2 reached 1980s (352 ppm, average) to 2000s (380 ppm, max) levels 2500-5500 years ago in Japan per stomata records.
Scientists (Wang et al., 2020) have determined stomatal evidence can uncover large short-term CO2 fluxes of 50-100 ppm within a century or less.
Measurements from a forest near Mt. Kurikoma, Japan, reveal minimum to maximum CO2 values ranged between 288 ppm (minimum) to 383 ppm (maximum) between 3,903 to 3,795 cal. yr BP. The region’s sea surface temperatures were 1-2°C warmer (23-24°C) than today (22°C) from about 4,000 to 5,500 years ago.
Holocene-CO2-reached-352-to-383-ppm-stomata-Wang-2020.jpg

Image Source: Wang et al., 2020
Other reconstructions have also determined CO2 fluctuates far more rapidly in stomatal records than in the records divined from bubbles in old ice. For example, CO2 rose from about 260 to 380 ppm during the century between 1850 and 1950 (Kouwenberg et al, 2005) and declined by 77 ppm in <200 years (Mcelwain et al., 2002) during the Younger Dryas abrupt cooling event per evidence from stomata. . . .
 
Research continues.

Physicists: A CO2 Rise To 800 ppm Causes ‘Hypothetical’ 10°C Upper Atmosphere Cooling, 1.4°C Surface Warming
By Kenneth Richard on 26. November 2020

Share this...
Share on FacebookTweet about this on Twitter
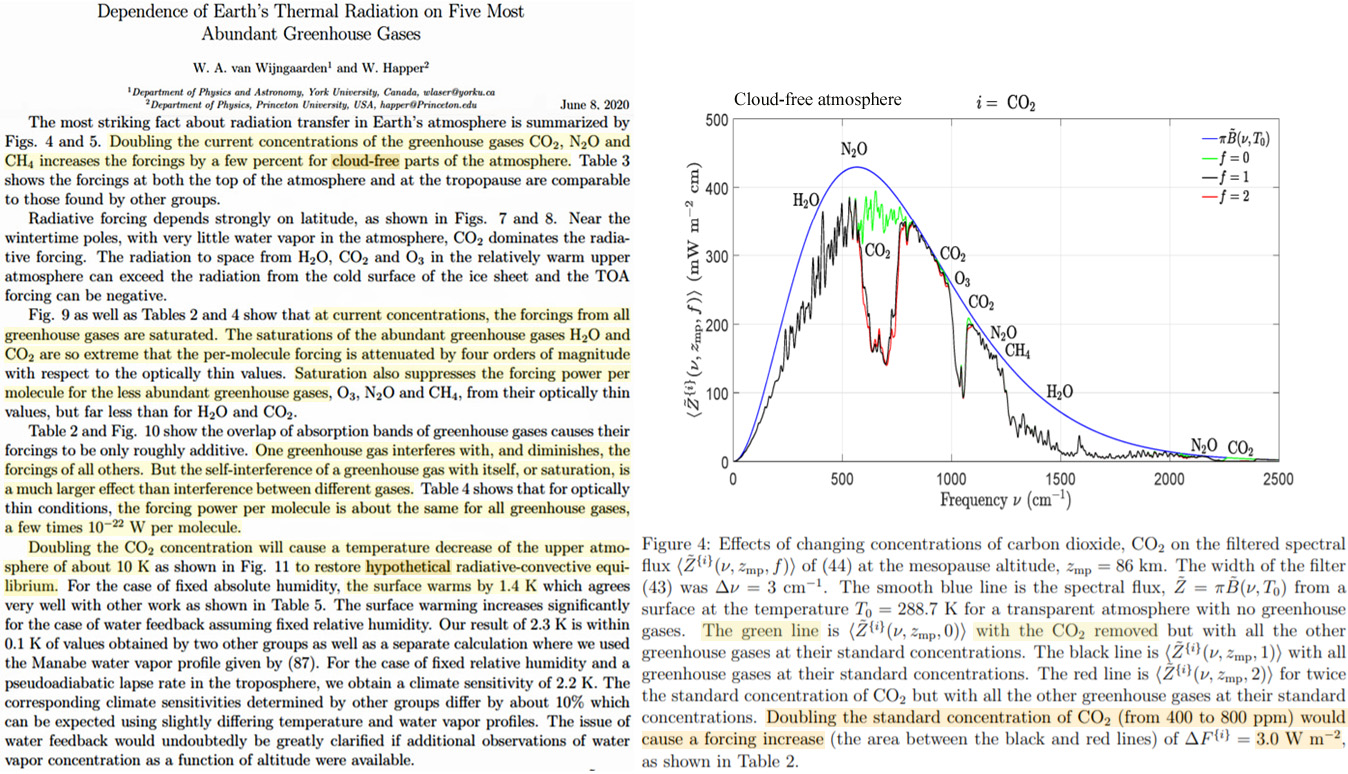
A new analysis by Drs. Wijngaarden and Happer (2020) suggests the “self-interference” saturation of all greenhouse gases in the current atmosphere substantially reduces their climate forcing power.
At the current concentrations, the forcing power for greenhouse gases like CO2 (~400 ppm) and CH4 (1.8 ppm) are already saturated. Therefore, even doubling the current greenhouse gas concentrations may only increase their forcings “by a few percent” in the parts of the atmosphere where there are no clouds. When clouds are present, the influence of greenhouse gases is even further minimized.
While the “consensus” model view is that doubling CO2 from 280 ppm to 560 ppm results in a surface forcing of 3.7 W/m², Wijngaarden and Happer find doubling CO2 concentrations from 400 to 800 ppm increases climate forcing by 3 W/m². This warms the surface by 1.4 K as it “hypothetically” cools the upper atmosphere by 10 K.
Equilibrium climate sensitivity (when positive feedback with water vapor is included) is identified as 2.2 K, which is only a 10% different than multiple other analyses.
Low-CO2-climate-sensitivity-forcings-saturated-Wijngaarden-Happer-2020.jpg

Image Source: Wijngaarden and Happer, 2020
 
Another blow against the empire.

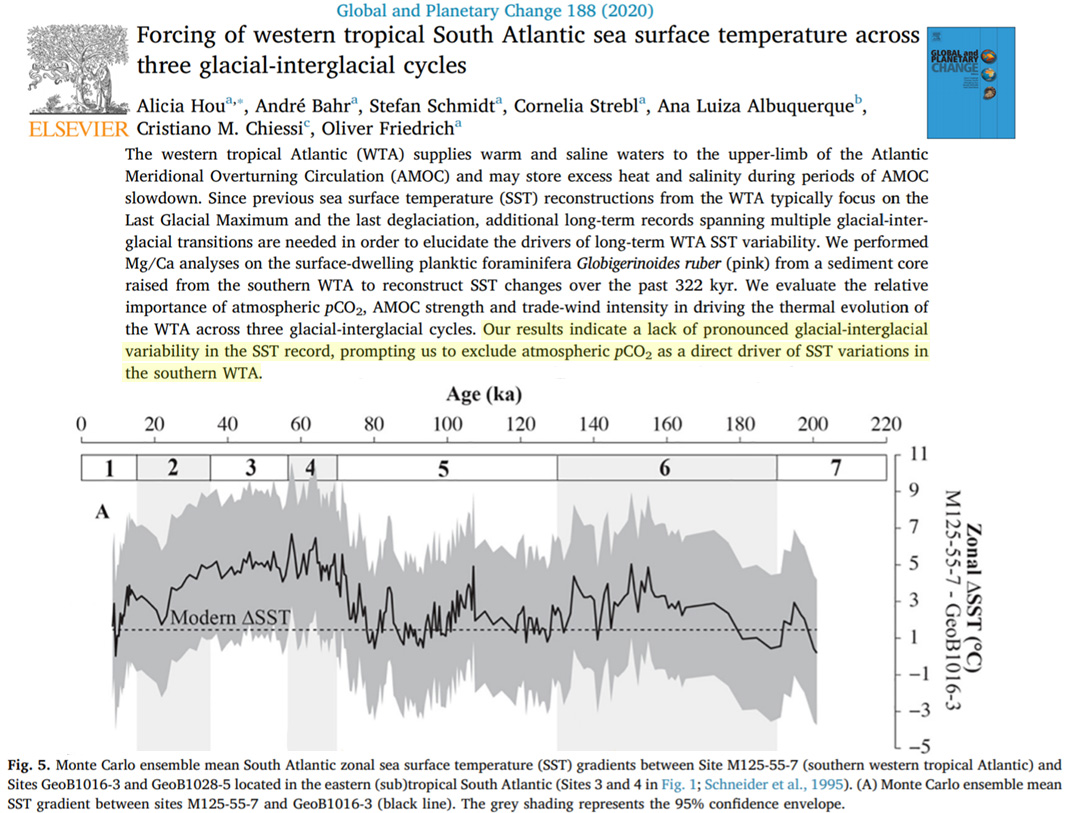
Another New Study Determines Sea Surface Temperatures Were 1-5°C Warmer Than Now During The Last ICE AGE
By Kenneth Richard on 30. November 2020

Share this...
Share on FacebookTweet about this on Twitter
Scientists report they must “exclude atmospheric pCO2 as a direct driver of SST variations” after finding the Atlantic Ocean’s surface was multiple degrees warmer than today from 90 to 20 thousand years ago, or when CO2 concentrations hovered below 200 ppm.
Another new study (Hou et al., 2020) casts even more doubt on the contention that CO2 concentrations are a driver of ocean temperature changes. Sea surface temperatures ranged between 1 and 5°C warmer than today throughout the last glacial period in the western tropical Atlantic.
“Our results indicate a lack of pronounced glacial-interglacial variability in the SST record, prompting us to exclude atmospheric pCO2 as a direct driver of SST variations in the southern WTA [western tropical Atlantic].”
Modern-SSTs-colder-than-glacials-and-nearly-all-of-the-last-200k-years-Hou-2020.jpg

Image Source: Hou et al., 2020
A Southern Ocean site was analyzed in another 2020 study (Ghadi et al.). Sea surface temperatures averaged 1-2°C during glacials and 4°C during interglacials. Today, with a 410 ppm CO2 concentration, this location has again plummeted to glacial/ice age levels (2°C). . . .
 
Back
Top Bottom