• This is a political forum that is non-biased/non-partisan and treats every person's position on topics equally. This debate forum is not aligned to any political party. In today's politics, many ideas are split between and even within all the political parties. Often we find ourselves agreeing on one platform but some topics break our mold. We are here to discuss them in a civil political debate. If this is your first visit to our political forums, be sure to check out the RULES. Registering for debate politics is necessary before posting. Register today to participate - it's free!

Florence's Records Should Be Noted

If the High Schooler Watts says so, it must be true.

I guess you did not read closely. The data were published in Geophysical Research Letters.

[FONT=&quot]". . . Likewise, the [/FONT]datasets[FONT=&quot] graphed below show that the global number and intensity of cyclones, hurricanes, and major hurricanes have been roughly level for the past four-to-five decades. These data were [/FONT]originally published[FONT=&quot] in the journal [/FONT]Geophysical Research Letters in 2011 and updated this year: . . . "
 
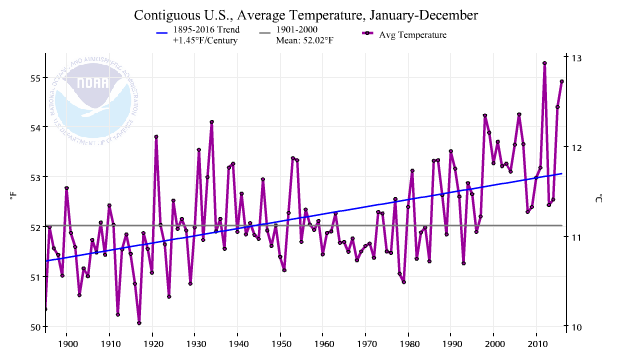
us-cag-annual-tavg-620.png


Sure.


We've been over your misinterpretation of this same chart, over and over. Look at the red line - and tell me how many years before 2000 are higher than the highest years after 2000?
 
We've been over your misinterpretation of this same chart, over and over. Look at the red line - and tell me how many years before 2000 are higher than the highest years after 2000?

1998 is higher than every year except 2016.
 
1998 is higher than every year except 2016.

So - your answer is "1". Thank you! After 2000, from your graph, fifteen of the hottest years on record. Thanks for posting. From your graph, I would think we can agree that Global Warming is occurring.
 
:roll:

Ad hominem attacks are not proof. All they show is that you have no evidence to back up your claims. Buh-bye.

I still have 30 and 40 year old peer-reviewed science articles warning the world of impending global cooling, based upon expert data collected extensively from the preceding 8 decades. Somebody is mixed up over at pc mob science peer-review headquarters.
 
So - your answer is "1". Thank you! After 2000, from your graph, fifteen of the hottest years on record. Thanks for posting. From your graph, I would think we can agree that Global Warming is occurring.

Only one hotter than 1998. The plateau was reached, and cooling has been under way since 2016.
 
I still have 30 and 40 year old peer-reviewed science articles warning the world of impending global cooling, based upon expert data collected extensively from the preceding 8 decades.
Yeah, OK. Guess what? Only about 10% of papers in the 70s predicted cooling, and at least some of them did so out of a belief that aerosol pollution would outweigh GHGs. (Aerosols do have a cooling effect, but they were wrong on the relative effects.)
https://journals.ametsoc.org/doi/pdf/10.1175/2008BAMS2370.1

A minority of scientists getting things wrong, at a time when the science was still very much in flux and the data/instrumentation wasn't as good, says pretty much nothing about the state of the science today.

Better luck next time.
 
Only one hotter than 1998. The plateau was reached, and cooling has been under way since 2016.

Not very scientific, Mr. Jack Hays. As a matter of fact, the acceptance of one outlier, would be considered quite irrational and unscientific.
 
Not very scientific, Mr. Jack Hays. As a matter of fact, the acceptance of one outlier, would be considered quite irrational and unscientific.

It makes sense when viewed from the perspective of the solar/GCR flux paradigm.
 
Yeah, OK. Guess what? Only about 10% of papers in the 70s predicted cooling, and at least some of them did so out of a belief that aerosol pollution would outweigh GHGs. (Aerosols do have a cooling effect, but they were wrong on the relative effects.)
https://journals.ametsoc.org/doi/pdf/10.1175/2008BAMS2370.1

A minority of scientists getting things wrong, at a time when the science was still very much in flux and the data/instrumentation wasn't as good, says pretty much nothing about the state of the science today.

Better luck next time.

So scientists are right except when they are wrong?
 
1998 is higher than every year except 2016.

Did you happen to catch my metaphor about the loaded die?

One roll of the die, one year, proves nothing. It's the thousand rolls of the die, the average temperatures over time that tell the tale.
 
Did you happen to catch my metaphor about the loaded die?

One roll of the die, one year, proves nothing. It's the thousand rolls of the die, the average temperatures over time that tell the tale.

Not this time. The point I have made repeatedly is that my view is shaped by the solar/GCR flux climate paradigm, and from that perspective a change has occurred.
 
Not this time. The point I have made repeatedly is that my view is shaped by the solar/GCR flux climate paradigm, and from that perspective a change has occurred.

and, according to you, the "solar/GCR flux climate paradigm" shows that the climate is cooling rather than warming.

Too bad the actual data don't support that.
 
On the contrary. 2016>2017>2018 . . . .

Correct, however:

graph.webp

Thee years does not make a trend. It's like my possibly loaded die, throw it three times, and you haven't learned anything.

Meanwhile, by decades:

graph3.webp

tells quite a different story.

Roll the die 10 times, then 10 times again, and again, and you begin to spot a trend. Roll it three times, and you can't tell anything.
 
Correct, however:

View attachment 67240684

Thee years does not make a trend. It's like my possibly loaded die, throw it three times, and you haven't learned anything.

Meanwhile, by decades:

View attachment 67240685

tells quite a different story.

Roll the die 10 times, then 10 times again, and again, and you begin to spot a trend. Roll it three times, and you can't tell anything.

The Sun is approaching minimum, and if the solar wind slackens sufficiently then GCR's will drive cooling. That's why these three years may just be thye beginning of many years of cooling.
 
The Sun is approaching minimum, and if the solar wind slackens sufficiently then GCR's will drive cooling. That's why these three years may just be thye beginning of many years of cooling.

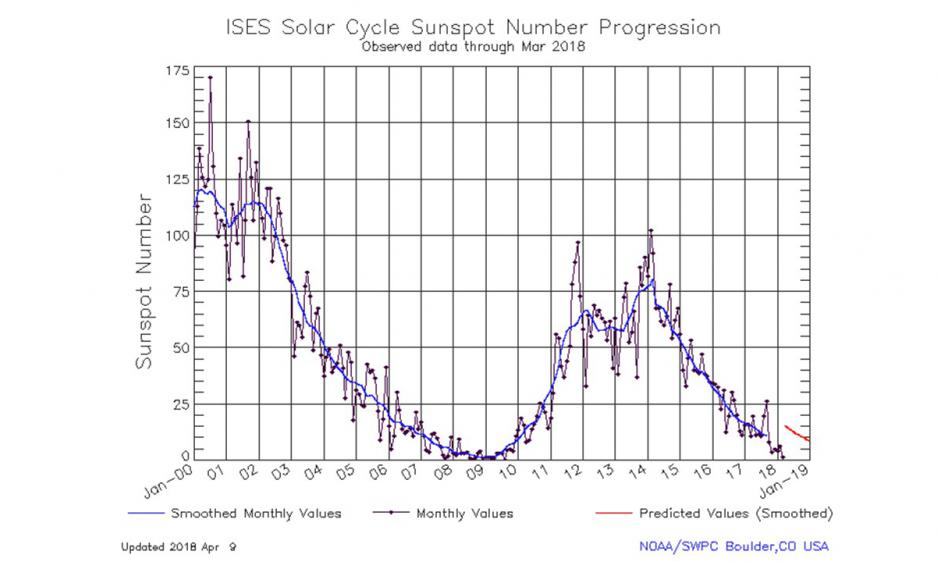
Can you see the correlation?

SolarCycle_graphic.jpg


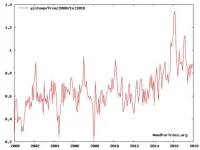
2000 to 2018.webp

No, me neither :roll:
 

We already have seen, or rather haven't seen. There has been no correlation whatsoever between solar activity and global temperature since at least the start of this century, and there's no particular reason for it to start now. And even if there were, we've just reached a solar minimum, so solar activity will be increasing over the next few years. So why are you expecting cooling?
 
We already have seen, or rather haven't seen. There has been no correlation whatsoever between solar activity and global temperature since at least the start of this century, and there's no particular reason for it to start now. And even if there were, we've just reached a solar minimum, so solar activity will be increasing over the next few years. So why are you expecting cooling?

From the link in #95. The Sun drove 20th century warming. In the 21st century we've had the Pause, an El Nino, and now cooling.

ssn2Fig2.gif
[FONT=&quot]Figure 2: The AA geomagnetic index showing a clear increase in solar activity over the 20th century (From here).[/FONT]


Why do I expect cooling? Because each successive solar cycle has been weaker, and the minima will be maximized, as it were.
 
The Sun is approaching minimum, and if the solar wind slackens sufficiently then GCR's will drive cooling. That's why these three years may just be thye beginning of many years of cooling.

So this year seems to be ending with some massive heating. If it surpasses 2017, will you become an AGW proponent?
 
We already have seen, or rather haven't seen. There has been no correlation whatsoever between solar activity and global temperature since at least the start of this century, and there's no particular reason for it to start now. And even if there were, we've just reached a solar minimum, so solar activity will be increasing over the next few years. So why are you expecting cooling?
Excellent question.

Here's a graph of GISS compared with solar activity (rescaled to fit). Not only does temperature not visibly change with the individual cycles, it doesn't match the longer trends either. Solar maximums have fallen with almost every cycle since the 50s, while temperatures consistently trend upwards.

GISS Anomaly and Solar Activity (scaled for display).webp


Even Jack's Favorite Chart doesn't help him (N.B.: trend line is only valid for the direction, not amount)

UAH Anomaly and Solar (scaled for display).webp

We do know that solar influences (e.g. Milankovich cycles) had an influence in the past. However, in the modern era, solar influences are overwhelmed by anthropogenic influences. E.g. the drop from the Medieval Warm Period to the lowest point of the Little Ice Age was around 1.5ºC, and took place over 400 years; that's 0.38ºC per century, or about 1/3 of current warming. And predicting today that the sun is going through a cycle like that is, to put it mildly, a bit of a stretch.
 
So this year seems to be ending with some massive heating. If it surpasses 2017, will you become an AGW proponent?

Actually, the descent continues. There is some possibility of an El Nino later in the year. That might pause the decline, but it will resume.
 
Back
Top Bottom