• Please read the Announcement concerning missing posts from 10/8/25-10/15/25.
  • This is a political forum that is non-biased/non-partisan and treats every person's position on topics equally. This debate forum is not aligned to any political party. In today's politics, many ideas are split between and even within all the political parties. Often we find ourselves agreeing on one platform but some topics break our mold. We are here to discuss them in a civil political debate. If this is your first visit to our political forums, be sure to check out the RULES. Registering for debate politics is necessary before posting. Register today to participate - it's free!

Fall Nights Are Warming in Our Changing Climate

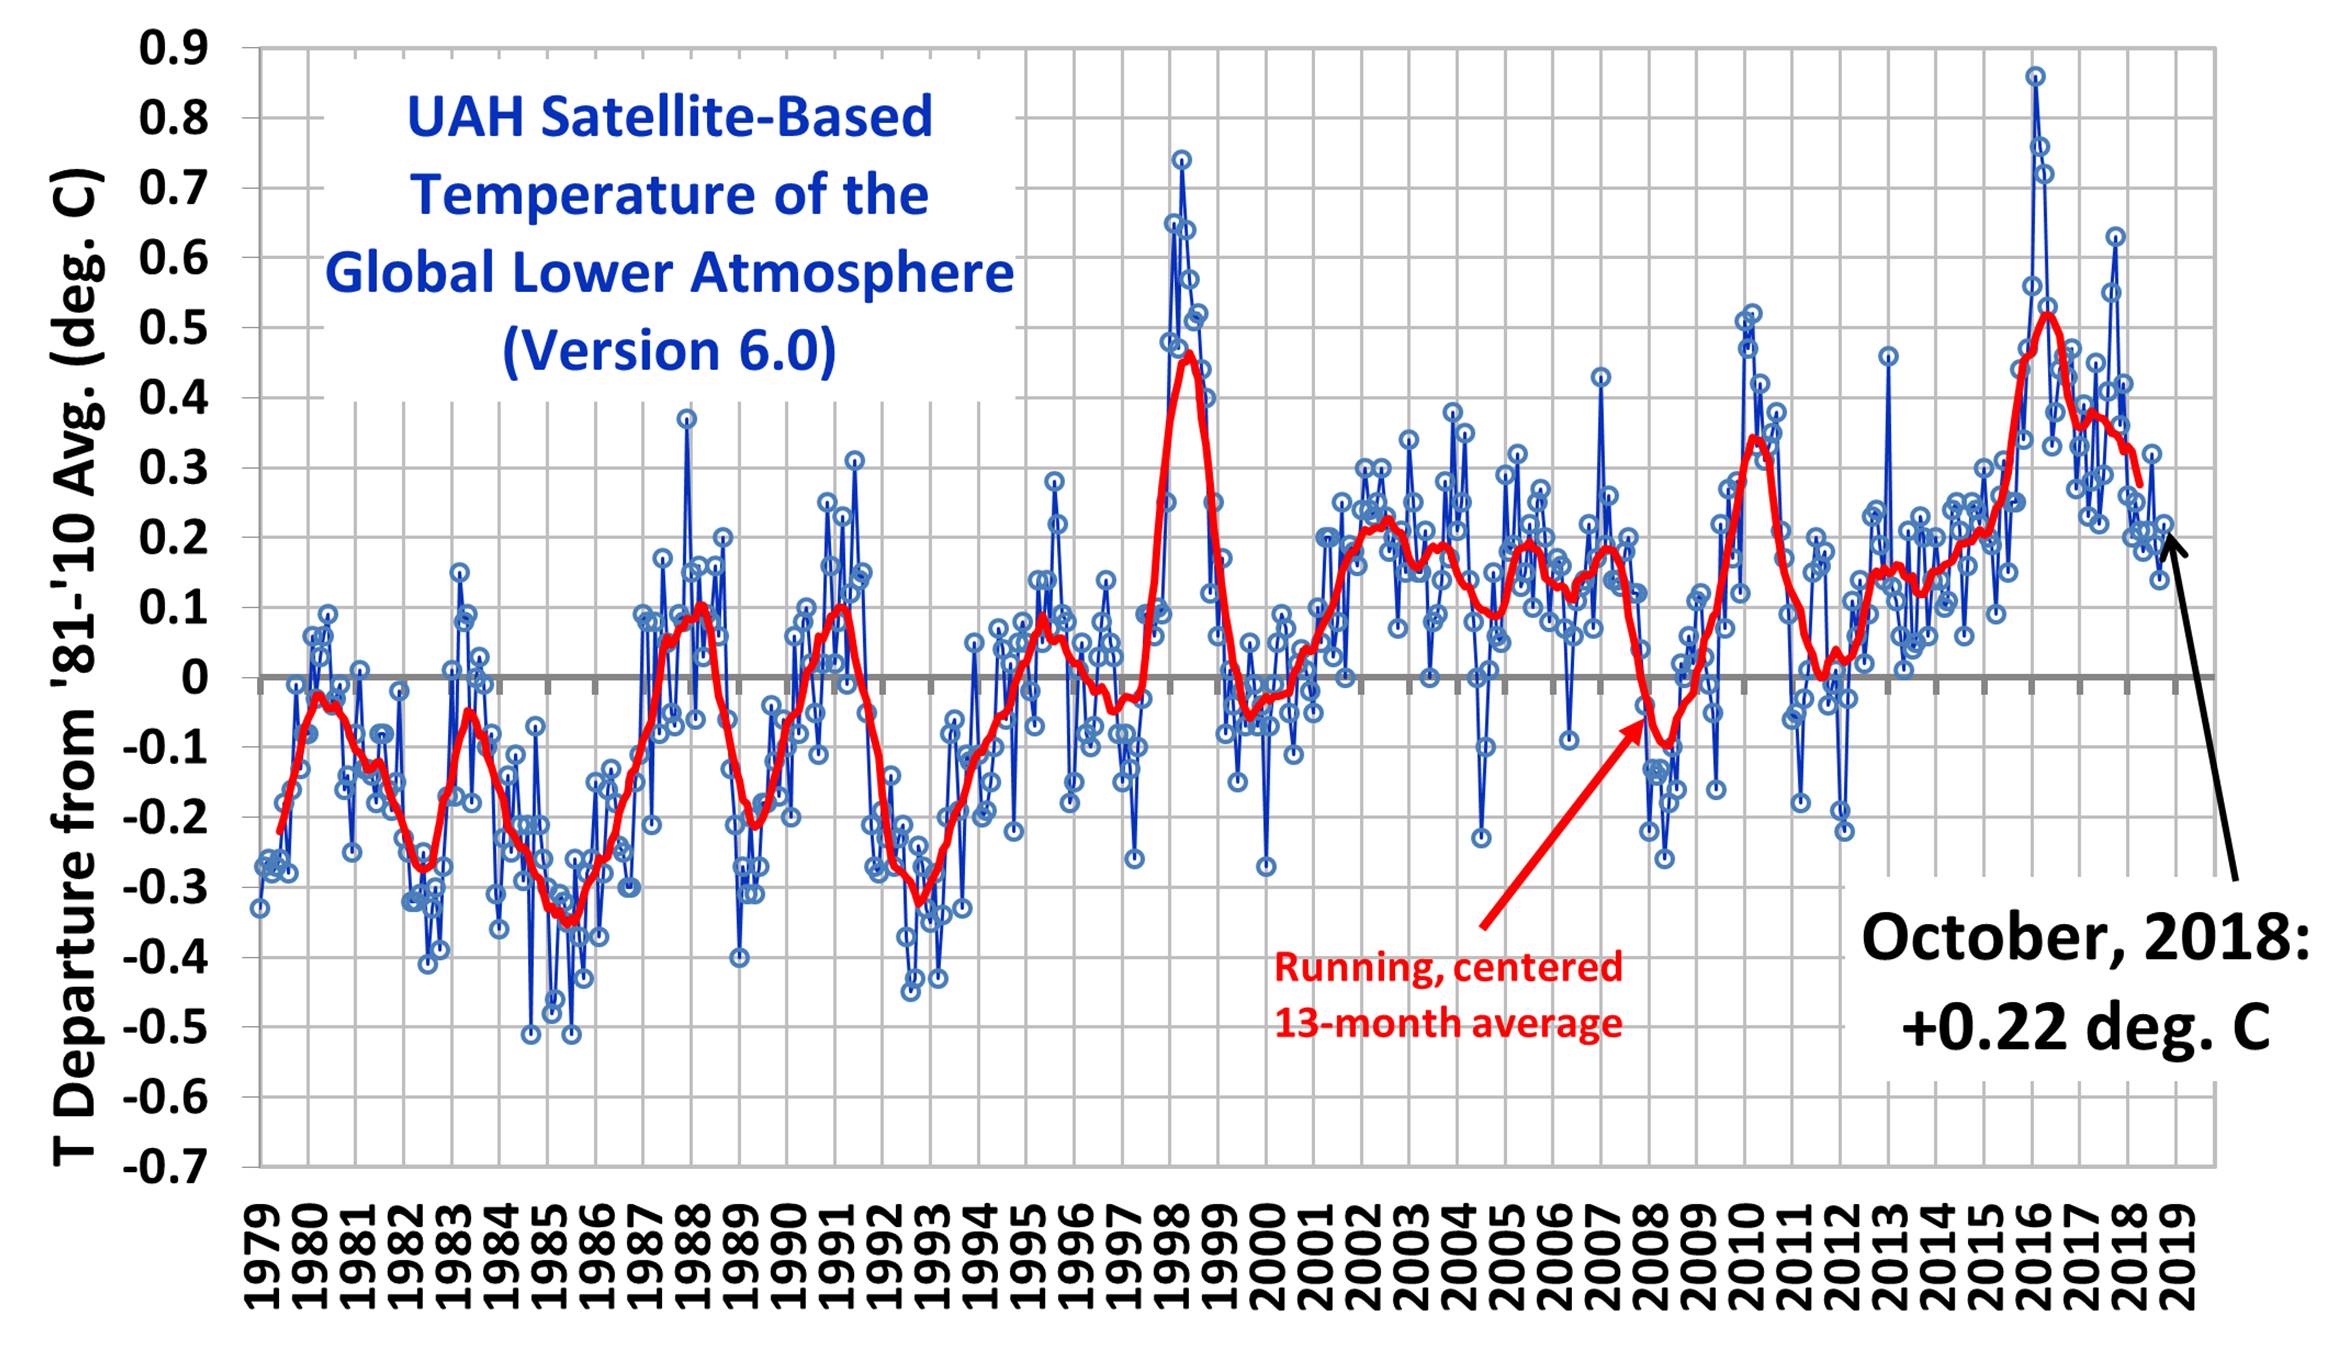
Roy Spencer? Let's take a look at some of Roy Spencer's conclusions.

View attachment 67243724

Roy and his colleagues started with talk about Global Cooling. Then when nearly every reputable scientist started questioning their methods, they modified their results to start showing warming. This article also talks about all the questionable methods and conclusions that they've drawn from their satellite data, that differed from the others, including the NOAA, performing similar studies.

https://www.theguardian.com/environ...rian-climate-scientists-temperature-estimates

You stoop to such low quality sources for your evidence; while ignoring the vast-vast resources of the rest of the scientific community.

No one who links to The Guardian has any credibility criticizing sources.
As for UAH temperatures, a look at the data shows that your chart merely reflects the temperature increase measured over time. The attack is amateurish hackery.

 
Since ... when? (you'll need a bigger graph)
And it doesn't show warming during the period in question.

Since 1979, when the satellites were launched. A line drawn through the entire RSS data set (rather than some carefully chosen time slice) shows clear warming. The Earth is undoubtedly warmer now than it was in 1979.
 
When you get lefties to insult you instead of answering a straight question, you know youve beat them. You guys are all full of ****. Oh oh dont waste electricity unless of course you need to post on an internet forum then its ok. I love the I have a windmill post therefore when I use the internet Im not wasting electricity. Thats a level of leftism I was in search of demonstrating. Reminds me of when dicaprio touts for us to stop wasting energy yet uses a personal jet that uses more fuel in one selfish trip than most Americans use all year to heat their homes. Spare us the global warming crap, you guys are just as much at fault if not more than the rest of us you are preaching to. Prove me correct and waste more energy by posting here.

Sounds like you have a real chip on your shoulder. FOX News goal is to incite anger. It looks like it's working with you...
 
That's because we are cooling.


The fact is looking at anything short of a 1000 or 10000 year temperature data structure is bias.
the climate runs in cycles that go 500-1000+ years at at time. sometimes it runs 200 years.

this business of these short lined graphs is not consistent and does not show proper temperature ranges or climate patterns.

even with your graph i see nothing that indicates that we are outside any dangerous margin of temperature
there are anomalies but that is expected and can be due to solar variability.

Right now the sun is entering it's solar minimum. in fact some scientists are worried about just how deep this minimum is.
it will take a few years to see where that leads us as part of our overall climate but if temperatures are starting to fall
then this very well could be the main cause.
 
okay.

monckton1.png


Also, I've warned others before to be very careful with any climate graphs that start in 1880.
What was going on before 1880?
One can tell any story one wants with careful time slice and graph component selection.
Becoming aware of climate change patterns through history would probably help ... for perspective, ya know?
So what WAS going on before 1880?

You do realize that you're looking at Satellite temperatures, don't you? They have a level of accuracy, but there are more variables that can lead to problems with the data. Averaged earthly temperature measurements are considered much more accurate. Nonetheless, your graph also shows warming, and surely you can get something that shows more recent data - such as the warmest year ever - 2016???
 
As I have posted several times, the change in 2016 is, IMHO, different. With the Sun approaching minimum, the prospect is for years, perhaps decades, of cooling.

The solar cycles are only about 11 years and a solar minimum only lasts about 2 years like the last one from 2007 to 2009. No big change to global temperature during those years.
Your alarmist hysteria about a long term supposed cooling trend due to the sun is not only unfounded but un-physical. The science and data are just not with you.
 
okay.

monckton1.png


Also, I've warned others before to be very careful with any climate graphs that start in 1880.
What was going on before 1880?
One can tell any story one wants with careful time slice and graph component selection.
Becoming aware of climate change patterns through history would probably help ... for perspective, ya know?
So what WAS going on before 1880?

Sheesh you dragged up an old graphic with cherry picked data by Christopher Monckton from some conspiracy pseudoscience blog and expect to have any credibility?

How about posting the most recent data straight from RSS? Doesn't suit your pseudoscience views?

RSS.webp

RSS / MSU and AMSU Data / Time Series Trend Browser
 
Last edited:
Oh that is just too hilarious. That powers your home does it? Sell the excess to the local electric company do ya?

Since you asked, homes have more energy requirements than electricity. The renewables satisfy the electrical requirement of my home. About 99% of heating is accomplished through passive solar and thermal mass. No A/C - the home is bermed and stays cool, with shades to keep the sun out on hot days (no humidity in CO). I used to sell the excess electricity to the local Utility - got a nominal check back at the end of the year. However, I bought a Chevy Volt, plug-in hybrid, and it now uses that excess. Usage part of electric bill is now about $10-20 per month.
 
The solar cycles are only about 11 years and a solar minimum only lasts about 2 years like the last one from 2007 to 2009. No big change to global temperature during those years.
Your alarmist hysteria about a long term supposed cooling trend due to the sun is not only unfounded but un-physical. The science and data are just not with you.

Combine this with Svensmark's solar/GCR flux hypothesis and you're looking at significant evidence of a temperature downturn.

[FONT=&quot][/FONT]
[h=1]The Millennial Turning Point – Solar Activity and the Coming Cooling[/h][FONT=&quot]Guest opinion by Dr. Norman Page When analyzing complex systems with multiple interacting variables it is useful to note the advice of Enrico Fermi who reportedly said “never make something more accurate than absolutely necessary”. My recent paper presented a simple heuristic approach to climate science which plausibly proposed that a Millennial Turning Point (MTP)…
[/FONT]

3 days ago November 2, 2018 in Solar.
 
No one who links to The Guardian has any credibility criticizing sources.
As for UAH temperatures, a look at the data shows that your chart merely reflects the temperature increase measured over time. The attack is amateurish hackery.


I get it. You don't like Climate Central and you don't like the Guardian, but you'll biblically subscribe to the High Schooler, Watts. Look up any Scientific source, and you'll find critique about your buddy, Roy, and his faulty methods.
 
I get it. You don't like Climate Central and you don't like the Guardian, but you'll biblically subscribe to the High Schooler, Watts. Look up any Scientific source, and you'll find critique about your buddy, Roy, and his faulty methods.

Another falsehood.
 
Since 1979, when the satellites were launched. A line drawn through the entire RSS data set (rather than some carefully chosen time slice) shows clear warming. The Earth is undoubtedly warmer now than it was in 1979.

And it's warmer now than even way farther back.
But the point was that hasn't become warmer over the last 15 or so years.
So the questions are ... why? and why not?
 
And it's warmer now than even way farther back.
But the point was that hasn't become warmer over the last 15 or so years.
So the questions are ... why? and why not?

Using global temperature datasets, 17 of the 18 warmest years have occurred since 2000, and the warmest ever was 2016.
 
The fact is looking at anything short of a 1000 or 10000 year temperature data structure is bias.
the climate runs in cycles that go 500-1000+ years at at time. sometimes it runs 200 years.

this business of these short lined graphs is not consistent and does not show proper temperature ranges or climate patterns.

even with your graph i see nothing that indicates that we are outside any dangerous margin of temperature
there are anomalies but that is expected and can be due to solar variability.

Right now the sun is entering it's solar minimum. in fact some scientists are worried about just how deep this minimum is.
it will take a few years to see where that leads us as part of our overall climate but if temperatures are starting to fall
then this very well could be the main cause.
The other side of the coin is that the 1000, and 10,000 year records have poor temporal resolution.
Marcott stated the average resolution of their reconstruction was 120 years.
It is questionable if the temperature increases in the last 40 years would even show up
on a record with a 120 year resolution.
 
Combine this with Svensmark's solar/GCR flux hypothesis and you're looking at significant evidence of a temperature downturn.

[FONT="][URL="https://wattsupwiththat.com/2018/11/02/the-millennial-turning-point-solar-activity-and-the-coming-cooling/"]
06-30-16-solar-sdo-100-years.jpg
[/URL][/FONT]

[h=1]The Millennial Turning Point – Solar Activity and the Coming Cooling[/h][FONT="][FONT=inherit]Guest opinion by Dr. Norman Page When analyzing complex systems with multiple interacting variables it is useful to note the advice of Enrico Fermi who reportedly said “never make something more accurate than absolutely necessary”. My recent paper presented a simple heuristic approach to climate science which plausibly proposed that a Millennial Turning Point (MTP)…[/FONT]
[/FONT][/COLOR]
[URL="https://wattsupwiththat.com/2018/11/02/the-millennial-turning-point-solar-activity-and-the-coming-cooling/"]3 days ago November 2, 2018[/URL] in Solar.


Sorry, I don't waste my time reading your endless copy and pasted amateur crap articles from conspiracy pseudoscience blogs like WUWT. The blog article is also written by non climate scientist Norman Page who works for the oil industry and whose predictions of impending cooling in the past have laughable failed. No credible scientist posts blog articles on that conspiracy blog.

Would you like to bet your house on Page's 'predictions' coming true? I'd be happy to take that bet. The physics is just not with you.
 
Last edited:
Using global temperature datasets, 17 of the 18 warmest years have occurred since 2000, and the warmest ever was 2016.

Warmest years, does not warming make!
We have been warming, generally since about 1978, so all recent years will be close to "warmest",
but that does not reflect on weather the climate is warming or cooling.
 
Sorry, I don't waste my time reading your endless copy and pasted amateur crap articles from conspiracy pseudoscience blogs like WUWT. The blog article is also written by non climate scientist Norman Page who works for the oil industry and whose predictions of impending cooling in the past have laughable failed.

Would you like to bet your house on Page's 'predictions' coming true? I'd be happy to take that bet. The physics is just not with you.

As you wish. I never wager, but I did start a thread to announce cooling has begun. We shall see in coming years, which I await (in the words of Mark Twain) "with the calm confidence of a Christian holding four aces."
 
And it's warmer now than even way farther back.
But the point was that hasn't become warmer over the last 15 or so years.
So the questions are ... why? and why not?

But it has become warmer over the last 15 or so years, as the full RSS dataset clearly shows. Your graph stops at the end of 2015, but 2016 and 2017 were hotter than any previously measured year.
 
Warmest years, does not warming make!
We have been warming, generally since about 1978, so all recent years will be close to "warmest",
but that does not reflect on weather the climate is warming or cooling.

What a bizarre statement.
 
What a bizarre statement.
Funny how words work!
You keep harping about "warmest" years, when "warmest" and "coldest", are steady state conditions.
The question is not is it warmer or colder that some other period, but is the warming continuing?
 
Funny how words work!
You keep harping about "warmest" years, when "warmest" and "coldest", are steady state conditions.
The question is not is it warmer or colder that some other period, but is the warming continuing?

A best-fit quadratic curve to the global temperature record would indicate that warming is not only continuing, but accelerating. There is no statistical evidence that warming has stopped, just wishful thinking.
 
As you wish. I never wager, but I did start a thread to announce cooling has begun. We shall see in coming years, which I await (in the words of Mark Twain) "with the calm confidence of a Christian holding four aces."

You're holding 4 jokers.
 
But it has become warmer over the last 15 or so years, as the full RSS dataset clearly shows. Your graph stops at the end of 2015, but 2016 and 2017 were hotter than any previously measured year.

He used one of Monckton's dishonest cherry-picked graphics starting in 1998 and ending in 2015 that can only be found on pseudoscience conspiracy blogs.

If they can't be honest and it's so easy to show their dishonesty, what's the point?

This is the TLT data from the RSS website

RSS.webp

RSS / MSU and AMSU Data / Time Series Trend Browser
 
Last edited:
Back
Top Bottom