You say the OLR would be higher without the greenhouse gases, which is likely true, but
does not answer the question if added CO2 causes warming.
Warming from the longwave spectrum would only happen if the decrease in OLR exceeded the increase in Planck radiation,
and it has not.
The IPCC's is based on the same flawed assumptions that added greenhouse gases always cause warming,
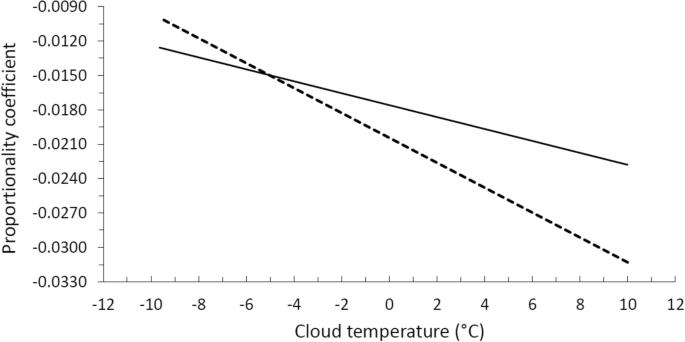
but what happens if the log curve is not continuous, and above a certain concentration added greenhouse gases
no longer cause warming? That is where we look like we are.
It is a question of scale and energy storage.
It is one things to say this country or that gets 80% of their electricity from alternative energy sources,
but that's not the whole story. With the exception of hydro, wind and solar are not dispatchable sources,
and not all the energy countries use is in the form of electricity. There is a large gap between what we produce with wind and solar
and what our current demands are. Yes we can reduce that gap, but not as fast as required.
View attachment 67581674
There are solutions that will get Earth to net zero CO2 emissions, but the people driving the agenda do not like them.
Battery electric cars in their current state, will not solve the problem. (if a problem exists).
The real problem is not cars, but Jets, Ships and Heavy trucks, all the applications that require portable
high density energy storage.
Anti EV sentiment, is not what you think and not anti EV, people have real concerns that Battery electric vehicles
cannot fill the need of how they used their vehicles currently, paying more for something that does not do all the jobs.
I admit the the battery technology is very close, and if they can get to 500 Wh/kg, that would do for 99% or cars, but
still would not solve the other problems.
The solution is to make the fuel carbon neutral, this would allow the surpluses from wind and solar to be stored
for years, and used on demand. All it needs is a higher price for oil, and that is happening on it's own.
Imagine for a second that in 2030 the price of oil reaches $100 a barrel, the refineries can purchase
surplus wholesale electricity from wind and solar for $40 per MWh, and with a storage efficiency of 70%
create olefins from Atmospheric CO2 and water for a price equal to $80 a barrel oil.
At that point I know which path they will choose.
The Navy has been doing research of how to make jet fuel from sea water, and the process works.
This low-cost catalyst helps turn seawater into fuel at scale
but the concept has the potential of providing Humanity a path to sustainable energy.
The answer is not reduce our standards to fit into the limits of current batteries, but to change the
definition of what a battery is, a device that carries energy.