• This is a political forum that is non-biased/non-partisan and treats every person's position on topics equally. This debate forum is not aligned to any political party. In today's politics, many ideas are split between and even within all the political parties. Often we find ourselves agreeing on one platform but some topics break our mold. We are here to discuss them in a civil political debate. If this is your first visit to our political forums, be sure to check out the RULES. Registering for debate politics is necessary before posting. Register today to participate - it's free!

Carbon dioxide causes 80% of global warming

watsup

DP Veteran
Joined
Jul 17, 2020
Messages
35,149
Reaction score
15,210
Location
Springfield MO
Gender
Male
Political Leaning
Liberal
“Radiative forcing increased by 32 per cent between 1990 and 2012, of wich 25 per cent is due to carbon dioxide. The remaining is from other greenhouse gases.
Carbon dioxide, mainly from fossil-fuel-related emissions, accounted for 80 per cent of global warming since 1990 according to the World Meteorological Organization’s (WMO) latest report from November 2013. Between 1990 and 2012 there was more than a 25 per cent increase in radiative forcing – the warming effect on our climate – because of carbon dioxide (CO2).

Carbon dioxide is the single most important greenhouse gas emitted by human activities such as fossil fuel burning and deforestation. CO2 lingers in the atmosphere for hundreds if not thousands of years and so will determine global mean surface warming by the late 21st century and beyond, states the WMO. “Most aspects of climate change will persist for centuries even if emissions of CO2 are stopped immediately.”

The WMO says that on the global scale, the amount of CO2 in the atmosphere reached 393.1 parts per million in 2012, or 141 per cent of the pre-industrial level of 278 parts per million. The amount of CO2 in the atmosphere increased by 2.2 parts per million from 2011 to 2012, which is above the average 2.02 parts per million per year for the past 10 years, showing an accelerating trend.”

 
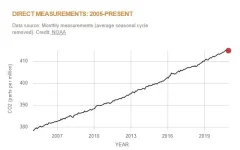
Atmospheric CO2 was pretty flat for the months of Oct, Nov, and Dec of 2020 at around 414.7 PPM, but there have been other periods like this. Overall CO2 continues on a steady rise. I'm not sure about the acceleration in the last 4 or 5 years. It looks like it's starting to taper off ever so slightly. Or maybe not? Maybe the efforts around the world are starting to pay off just a little?


co2-graph_to_2020.jpg
 
CO2 absorbs solar radiation within a narrow specific range. It already absorbs all of the incoming solar radiation in that range. It simply doesn't matter how much more CO2 we put into the atmosphere.
 
CO2 absorbs solar radiation within a narrow specific range. It already absorbs all of the incoming solar radiation in that range. It simply doesn't matter how much more CO2 we put into the atmosphere.
Link for that whopper please.
 
Show how they’re wrong.
let's put there numbers to the test.
Decade averaged warming between 1990 and 2012, was (BEST) .433C
Wood For Trees Raw data 120 month mean (BEST)
And the recorded increase in greenhouse gasses was a CO2-eq of 417 in 1990 and 474 in 2012,
SERL/NOAA
The recorded forcing would be 5.35 X ln(474/417) X.3 = .205C.
Since the recorded warming was .433 C, and the recorded forcing from all greenhouse gasses was .205C.
it is safe to say that something besides increases in greenhouse gasses caused more than 50% of the warming in that time window.

You are very good at repetition.
 
You are very good at repetition.
And the stated case was dis proven!
The reality is that CO2 warming attribution is a subtraction method.
They look at all the warming, and then subtract out all the known other causes of warming.
As knowledge of causes of warming expands, more and more is subtracted from what
can be attributed to CO2!
The same time window in the study saw greater amounts of available sunlight reaching the ground,
from clearing of aerosols in the Northern Hemisphere, the brightening was enough to increase the global average by .2C.
Yet another portion of warming that cannot be attributed to CO2.
 
let's put there numbers to the test.
Decade averaged warming between 1990 and 2012, was (BEST) .433C
Wood For Trees Raw data 120 month mean (BEST)
And the recorded increase in greenhouse gasses was a CO2-eq of 417 in 1990 and 474 in 2012,
SERL/NOAA
The recorded forcing would be 5.35 X ln(474/417) X.3 = .205C.
Since the recorded warming was .433 C, and the recorded forcing from all greenhouse gasses was .205C.
it is safe to say that something besides increases in greenhouse gasses caused more than 50% of the warming in that time window.
Or maybe it was the added effect of feedbacks from GHGs.
 
And the stated case was dis proven!
The reality is that CO2 warming attribution is a subtraction method.
They look at all the warming, and then subtract out all the known other causes of warming.
As knowledge of causes of warming expands, more and more is subtracted from what
can be attributed to CO2!
The same time window in the study saw greater amounts of available sunlight reaching the ground,
from clearing of aerosols in the Northern Hemisphere, the brightening was enough to increase the global average by .2C.
Yet another portion of warming that cannot be attributed to CO2.
This is just wrong. Aerosols were blocking the warming that would have happened because of increasing CO2. And now that blocking has been reduced in some areas of the planet(it has increased in other areas) it now is no longer offsetting the warming from GHGs. So... a decline in aerosols would actually allow CO2 to cause more warming.
 
Or maybe it was the added effect of feedbacks from GHGs.
The article was about forcing increases,not feedbacks, here is the opening statement,
"Radiative forcing increased by 32 per cent between 1990 and 2012, of wich 25 per cent is due to carbon dioxide.
The remaining is from other greenhouse gases. "
The AGGI is almost all the greenhouse gasses.
 
This is just wrong. Aerosols were blocking the warming that would have happened because of increasing CO2. And now that blocking has been reduced in some areas of the planet(it has increased in other areas) it now is no longer offsetting the warming from GHGs. So... a decline in aerosols would actually allow CO2 to cause more warming.
Aerosols cause dimming from 1950 to roughly 1985, and brightening after that, the period covered in the statement,
1990 to 2012, was completely in the brightening period.
 
Aerosols cause dimming from 1950 to roughly 1985, and brightening after that, the period covered in the statement,
1990 to 2012, was completely in the brightening period.
Not true. Mount Pinataubo erupted in 1991. Read about it's effects.


...Over the course of the next two years strong stratospheric winds spread these aerosol particles around the globe.

Unlike the lower atmosphere (or troposphere, which extends from the surface to roughly 10 km), the stratosphere does not have rain clouds as a mechanism to quickly wash out pollutants. Therefore, a heavy influx of aerosol pollutants, like the plume from Mount Pinatubo, will remain in the stratosphere for years until the processes of chemical reactions and atmospheric circulation can filter them out. In the case of Mount Pinatubo, the result was a measurable cooling of the Earth’s surface for a period of almost two years.

Because they scatter and absorb incoming sunlight, aerosol particles exert a cooling effect on the Earth’s surface.

...Consequently, over the next 15 months, scientists measured a drop in the average global temperature of about 1 degree F (0.6 degrees C).
A temporary change, the brightening continues today, although not at the 1985 to 2000 pace.
Global dimming and brightening
 
A temporary change, the brightening continues today, although not at the 1985 to 2000 pace.
Global dimming and brightening
Two years is a long time for volcanic eruption aerosols to stay dispersed. Not sure I agree with your use of the word "temporary". There have been a large number of volcanic eruptions just since 2000. It is, and will continue to be part of the complex climate cause and effect.

 
Two years is a long time for volcanic eruption aerosols to stay dispersed. Not sure I agree with your use of the word "temporary". There have been a large number of volcanic eruptions just since 2000. It is, and will continue to be part of the complex climate cause and effect.

The data suggests that only slowed a large brightening trend in the Northern Hemisphere in that 1990 to 2012 time period.
Enlightening Global Dimming and Brightening
Figure 4 shows the trend.
In any cast we digress, the paper about the period to maximum warming was based on CMIP5 model,
and that model includes all the feedbacks, least it would not be able to produce an ECS range.
The later paper show a longer lag with much higher CO2 impulses.
Ricke and Caldeira (2014 Environ. Res. Lett. 9 124002) Found a 10.1 year maximum warming for a 100 GtC pulse
Kirsten Zickfeld1 and Tyler Herrington1,2 found a 1000 GtC pulse produced maximum warming after 31 years,
and a 5000 GtC pulse took 785 years to reach maximum warming.
So
100 GtC 10.1 years
1000 GtC 31 years
5000 GtC 785 years
Human annual emissions 9.75 GtC.
What does this trend tell you about the lag between emission and maximum warming?
Your article was authored in 2012, and had this to say in it's conclusion: "We cannot exclude the possibility that we are cur-rently again in a transition phase and may return to a renewed overall dimming for some years to come."

Sounds like they have failed in their assessment, since the warmest years on record are since then. I guess the IPCC knew what they were talking about.
You do not have sufficient data to draw that conclusion.
Also warmest years, and continued warming, say nothing about the rate of warming
 
You do not have sufficient data to draw that conclusion.
Also warmest years, and continued warming, say nothing about the rate of warming

Dismissing out-of-hand warmest years and continued warming as “saying nothing”—means nothing in and of itself.
 
Dismissing out-of-hand warmest years and continued warming as “saying nothing”—means nothing in and of itself.
If there is any warming for any reason, then every year will be a warmest year, the statement does not speak to a rate of warming or a cause of warming.
 
You do not have sufficient data to draw that conclusion.
Also warmest years, and continued warming, say nothing about the rate of warming
Again, the article that you are citing, from 2012, made this statement - "We cannot exclude the possibility that we are cur-rently again in a transition phase and may return to a renewed overall dimming for some years to come."

They didn't say, "In about 9 years we start to see more dimming". They stated "we are currently". That means NOW. They were wrong. Case closed. Next argument.
 
If there is any warming for any reason, then every year will be a warmest year, the statement does not speak to a rate of warming or a cause of warming.
The original link of this thread talks about the "cause of warming". You chose to ignore that cause, and presented your own theories from 2012, which have already fallen flat.
 
The original link of this thread talks about the "cause of warming". You chose to ignore that cause, and presented your own theories from 2012, which have already fallen flat.
The original link’s statement was incorrect!
I was showing why. The forcing from added CO2 does not account for 80% of the warming in the time period stated!
 
Again, the article that you are citing, from 2012, made this statement - "We cannot exclude the possibility that we are cur-rently again in a transition phase and may return to a renewed overall dimming for some years to come."

They didn't say, "In about 9 years we start to see more dimming". They stated "we are currently". That means NOW. They were wrong. Case closed. Next argument.
Greenhouse gas forcing is very real, and will cause some warming, but that alone does not validate the full suite of catastrophic predictions.
We do not really have a good idea of the actual forcing form2XCO2!
 
  • Like
Reactions: PoS
Back
Top Bottom