• This is a political forum that is non-biased/non-partisan and treats every person's position on topics equally. This debate forum is not aligned to any political party. In today's politics, many ideas are split between and even within all the political parties. Often we find ourselves agreeing on one platform but some topics break our mold. We are here to discuss them in a civil political debate. If this is your first visit to our political forums, be sure to check out the RULES. Registering for debate politics is necessary before posting. Register today to participate - it's free!

Capturing Global Warming in One Simple Statistic [W:1239:1469]

Re: Capturing Global Warming in One Simple Statistic

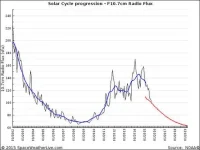
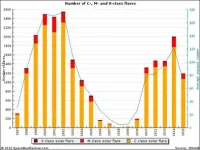
Below is a series of graphs from this source (Solar Cycle progression | Solar activity | SpaceWeatherLive.com ) which show the solar cycle and various classes of solar flares since 2002 and 1997, respectively:

zonnecyclus_groot.webp

zonnecyclus_groot (1).webp

CMX_cyclus.webp

If there's any association at all with a solar effect on global warming it seems to be that peak solar activity is inversely related to the hottest years on record over the past two decades.
 
Re: Capturing Global Warming in One Simple Statistic

"Many researchers believe....."

That's really weak beer even by your low standards, long. The actual data tells a very different story of very minor role for solar effects. This has been shown to you many times and you continue to ignore it as you do all the other facts that destroy your myth of "cooling."
Let's see what the actual data says.
http://lasp.colorado.edu/home/sorce/files/2011/09/TSI_TIM_Reconstruction.txt
TSI
1880.5 1360.43 Wm-2
2014.5 1361.40 Wm-2
Difference .97 Wm-2
The IPCC states that an energy imbalance of 3.71 Wm-2 would cause 1.2°C of warming.
With that ratio, what would an energy imbalance of .97 Wm-2 cause?
(1.2/3.71)=.323, .323*.97 Wm-2= .31°C of warming.
And the direct response from the added CO2 still counts for .556°C of warming.
Not a lot left over for amplified feedback.

Also within the RSS and UAH annual data sets, the numerical temperature has "cooled" since 1998,
but not to statistically significant level.
 
Re: Capturing Global Warming in One Simple Statistic

Clearing up some loose ends here. The quotes below come from this article:

Understanding global sea levels: past, present and future
John A. Church Æ Neil J. White Æ Thorkild Aarup Æ W. Stanley Wilson Æ
Philip L. Woodworth Æ Catia M. Domingues Æ John R. Hunter Æ Kurt Lambeck
Received: 7 September 2007 / Accepted: 20 December 2007 / Published online: 1 February 2008

Sustainable Science(2008) 3:9-22
I am guessing you don't like NOAA's sea level data.
Sea Level Trends - NOAA Tides and Currents
The data from the satellite altimeters has very limited accuracy,
currently about 34 mm.
Think about it, satellites have been measuring sea level for 22 years (since 1993),
and claim a 3.1 mm per year rate of increase, when it would take 11 years at that rate
to cross a single minimum resolvable unit.
https://www.eumetsat.int/jason/print.htm#page_1.3.0
Jason maps 95% of the world's ice-free oceans every ten days. Sea surface height accuracy is currently 3.4 centimetres, with 2.5 expected in the future.
 
Re: Capturing Global Warming in One Simple Statistic

Let's see what the actual data says.
http://lasp.colorado.edu/home/sorce/files/2011/09/TSI_TIM_Reconstruction.txt
TSI
1880.5 1360.43 Wm-2
2014.5 1361.40 Wm-2
Difference .97 Wm-2
The IPCC states that an energy imbalance of 3.71 Wm-2 would cause 1.2°C of warming.
With that ratio, what would an energy imbalance of .97 Wm-2 cause?
(1.2/3.71)=.323, .323*.97 Wm-2= .31°C of warming.
And the direct response from the added CO2 still counts for .556°C of warming.
Not a lot left over for amplified feedback.

Also within the RSS and UAH annual data sets, the numerical temperature has "cooled" since 1998,
but not to statistically significant level.

I really feel sorry for you, long.
 
Re: Capturing Global Warming in One Simple Statistic

I am guessing you don't like NOAA's sea level data.
Sea Level Trends - NOAA Tides and Currents
The data from the satellite altimeters has very limited accuracy,
currently about 34 mm.
Think about it, satellites have been measuring sea level for 22 years (since 1993),
and claim a 3.1 mm per year rate of increase, when it would take 11 years at that rate
to cross a single minimum resolvable unit.
https://www.eumetsat.int/jason/print.htm#page_1.3.0


Every time one of your false claims gets smacked down you've got another one ready. It's climate denier whack-a-mole 24/7/365. It's a tribute to the vast rightwing lie machine that keeps pumping these things out for saps to post somewhere like this. The very links you put up contradict what your superiors tell you to write down. Aren't you tired of being used like this, long?
 
Re: Capturing Global Warming in One Simple Statistic

Then do it again. C'mon, tough guy.

I don't have all day to waste on your insecurities and delusions.

When you have a knew, original thought that has anything to do with the topic, respond to a post of mine.
 
Re: Capturing Global Warming in One Simple Statistic

Good luck with that defense. ["By the way, yer honor; I didn't kill the guy. I merely fired and he got in the way of my bullet."]

I don't have all day to waste on your insecurities and delusions.

When you have a knew, original thought that has anything to do with the topic, respond to a post of mine.
 
Re: Capturing Global Warming in One Simple Statistic

Clearing up some loose ends here. The quotes below come from this article:

Understanding global sea levels: past, present and future
John A. Church Æ Neil J. White Æ Thorkild Aarup Æ W. Stanley Wilson Æ
Philip L. Woodworth Æ Catia M. Domingues Æ John R. Hunter Æ Kurt Lambeck
Received: 7 September 2007 / Accepted: 20 December 2007 / Published online: 1 February 2008

Sustainable Science(2008) 3:9-22

A civil response to a civil question. Thank you. It did not address the exact question, but I don't know if there is a specific response to that question.

From what I've read on this, I haven't seen many citations of the exact rise of the sea level since the warming started after the coolest part of this interglacial. I read an article on the receding glaciers in the American Northwestern Coast where it runs up into Canada and those glaciers have been receding since the first trappers arrived there.

Obviously, they did not arrive there in SUV's.

Going solely on the record of the climate from both the proxies and the anecdotes, it seems reasonable to assume the the sea level was rising through most of the first millennium and then started to recede, again, and now has started to rise, again.

That is, "reasonable" if temperature is what affects sea level rise or fall.
 
Re: Capturing Global Warming in One Simple Statistic

I just love how deniers create assumptions out of whole cloth as needed to sustain their science denial.

Just to help you to re-establish your tether to reality, the name of this forum is "Debate POLITICS".

Including the political aspect of this is not only appropriate in this forum, it is essential.

That said, what assumption did I "create" in that statement?
 
Re: Capturing Global Warming in One Simple Statistic

All of these possibilities and hypotheses are thoroughly dealt with in the latest IPCC report (AR5) of 2014. They are not dismissed at all. The report includes references to multiple sources that studied these factors and the scientific consensus is that they play at most a minor role in the climate change we're experiencing now. I've linked to the parts of AR5 (chapter 10, I believe) that discusses these factors in some detail. The rest of the above comment is just standard denialist projection (not the scientific kind of projection).

Alrighty, then.

Why does the impact of rising CO2, seem to ebb and flow rather than consistently driving climate in a consistent manner?

Even the vaunted instrument record shows that the climate has warmed and cooled over the period since 1880.

The measure of the rise of CO2 has shown a very consistent upward track.

As the dominant factor, shouldn't it be, well, dominant?
 
Re: Capturing Global Warming in One Simple Statistic

More house cleaning (so many of these silly things that I missed). Here code just looks at the little black dots on that graph and ignores the bright red median trend line. Then he gets his feelings hurt that I can't take anything he puts up seriously.

I don't have all day to waste on your insecurities and delusions.

When you have a knew, original thought that has anything to do with the topic, respond to a post of mine.
 
Re: Capturing Global Warming in One Simple Statistic

Well, look at that. You've finally demonstrated how you've been misusing the word "prediction" all along. Everything you've been calling "predictions" have been projections. In fact, the IPCC has issued no climate predictions as yet since, as I showed in another excerpt from the IPCC's AR5, chapter 11, this process is "in its infancy."

THIS is what you take from this?

YOU used the terms "Projection" and "Scenario" as synonyms.

The IPCC clearly says the YOU ARE WRONG. I will merely note, for those keeping score at home, that you being wrong seems to happen with great frequency.

You again here demonstrate that your ability to read and comprehend is lacking. According to the definitions above, a projection becomes a prediction when it is "branded most likely".

To put this in terms that you might understand, all thumbs are fingers, but not all fingers are thumbs. All idiots are people, but not all people are idiots.

In this discipline, all predictions are projections, but not all projections are predictions.

Are you starting to grasp the subtleties of the language?

You are becoming less entertaining and more tedious.
 
Re: Capturing Global Warming in One Simple Statistic

Every time one of your false claims gets smacked down you've got another one ready. It's climate denier whack-a-mole 24/7/365. It's a tribute to the vast rightwing lie machine that keeps pumping these things out for saps to post somewhere like this. The very links you put up contradict what your superiors tell you to write down. Aren't you tired of being used like this, long?
What I find strange, is your level of denial of data and references, and you inability to refute any of it.
I suspect you do not even understand why the poseidon3 altimeter can only have an accuracy of 2.5 CM.
It is all right in the link
https://sealevel.jpl.nasa.gov/technology/
They just don't say why the accuracy is limited to 2.5 cm, but all the data necessary is there.
 
Re: Capturing Global Warming in One Simple Statistic

I don't have all day to waste on your insecurities and delusions.

When you have a knew, original thought that has anything to do with the topic, respond to a post of mine.

That's as good a retreat excuse as any. Are you ready to apologize for calling me a liar, now?
 
Re: Capturing Global Warming in One Simple Statistic

What I find strange, is your level of denial of data and references, and you inability to refute any of it.
I suspect you do not even understand why the poseidon3 altimeter can only have an accuracy of 2.5 CM.

Strange is exactly right for that comment, long. Bizarre, really. You've completely ignored the very detailed analysis of accelerating sea level rise that I supplied to one of your denier buddies (Tim, I believe, but might have been "code") and created yet another false set of conditions and irrelevant side issues. Your claims now come pre-refuted but you refuse to look at the evidence.
 
Re: Capturing Global Warming in One Simple Statistic

THIS is what you take from this?

YOU used the terms "Projection" and "Scenario" as synonyms.

The IPCC clearly says the YOU ARE WRONG. I will merely note, for those keeping score at home, that you being wrong seems to happen with great frequency.

You again here demonstrate that your ability to read and comprehend is lacking. According to the definitions above, a projection becomes a prediction when it is "branded most likely".

To put this in terms that you might understand, all thumbs are fingers, but not all fingers are thumbs. All idiots are people, but not all people are idiots.

In this discipline, all predictions are projections, but not all projections are predictions.

Are you starting to grasp the subtleties of the language?

You are becoming less entertaining and more tedious.

No, you--a denier--say I am wrong. Your IPCC quote actually and quite literally is evidence that you have been misusing the world "prediction" just as I've charged you ever since you showed up on this discussion. You have company, of course. Longview is all in on that false use. It's a denier ploy to make people think there's a strict timeline for specific climate changes which does not exist so you can make the false conclusion from that false premise that climate scientists are "alarmist" and have been wrong every time. It's actually a bit hilarious because I really believe that your ideology totally overwhelms any reasoning capacity any of you might have. You have actually convinced yourselves of the righteousness of your cause and have adopted an orwellian vocabulary to further that ideology (as opposed to scientifically) driven cause.
 
Re: Capturing Global Warming in One Simple Statistic

What I find strange, is your level of denial of data and references, and you inability to refute any of it.
I suspect you do not even understand why the poseidon3 altimeter can only have an accuracy of 2.5 CM.
It is all right in the link
https://sealevel.jpl.nasa.gov/technology/
They just don't say why the accuracy is limited to 2.5 cm, but all the data necessary is there.

Here's what I'm talking about when I say your comments come pre-refuted, long. From your own link:

This accuracy figure pertains to a few-kilometer spot on the ocean surface directly beneath the satellite. By averaging the few-hundred thousand measurements collected by the satellite in the time it takes to cover the global oceans (10 days), global mean sea level can be determined with a precision of several millimeters.

So you go to all that trouble to find a source and then comb it for some little tidbit that your denierism can use and you miss the part that should have warned you off. Actually, I suspect that you don't read these links at all but you find them at WUWT or some other denier clearinghouse that supplies you with the quote you need and you still haven't learned not to trust a pathological liar like Anthony Watts or whomever your primary source for all these bogus quotes you transfer to these discussions.
 
Re: Capturing Global Warming in One Simple Statistic

I don't have all day to waste on your insecurities and delusions.

When you have a knew, original thought that has anything to do with the topic, respond to a post of mine.

Does that mean you'll stop putting up false denier propaganda about climate change?
 
Re: Capturing Global Warming in One Simple Statistic

Alrighty, then.

Why does the impact of rising CO2, seem to ebb and flow rather than consistently driving climate in a consistent manner?
Because climate is still a sum of weather over time. No climate scientist has even claimed there would stop being fluctuations in weather. I realize your ideology has drummed that false belief incessantly into your head but it's a complete lie.

Even the vaunted instrument record shows that the climate has warmed and cooled over the period since 1880.

And yet there's been a steady rise of global average temperatures for at least since the mid-70s. I know you have a hard time with those graphs with all those connected dots and the very saw-tooth appearance. But here's what statisticians do to make those graphs more meaningful. Each brief interval has a "mean" (I'm going to assume that you know what the mathematical definition of that word is). When they determine that mean they connect that point with all the other means that come before and after and come up with what's called a "trend line" (it has other names but that's the easiest to understand for someone like you, I think, isn't it). The trend line smoothes out all the short-term fluctuations that give the graph is jagged appearance to show the actual direction on the y-axis those points are going. Depending on how many points are entered on the graph even the trend line may show some fluctuations over brief periods of time. The trend line for global average temperatures is on a steady upward (positive) slope.
The measure of the rise of CO2 has shown a very consistent upward track.

As the dominant factor, shouldn't it be, well, dominant?

Yes and yes. Your point is......?
 
Re: Capturing Global Warming in One Simple Statistic

Just to help you to re-establish your tether to reality, the name of this forum is "Debate POLITICS".

Including the political aspect of this is not only appropriate in this forum, it is essential.

That said, what assumption did I "create" in that statement?

I'm of the school that says debating should have an element of fact involved. You apparently are not familiar with that school.
 
Re: Capturing Global Warming in One Simple Statistic

Here's what I'm talking about when I say your comments come pre-refuted, long. From your own link:


So you go to all that trouble to find a source and then comb it for some little tidbit that your denierism can use and you miss the part that should have warned you off. Actually, I suspect that you don't read these links at all but you find them at WUWT or some other denier clearinghouse that supplies you with the quote you need and you still haven't learned not to trust a pathological liar like Anthony Watts or whomever your primary source for all these bogus quotes you transfer to these discussions.
You should read up on the term significant figures, it means something.
Math Skills - Scientific Notation
The satellites only have an accuracy of 3.4 cm, any number reported more accurate than that is a guess.
Average 10,000 guesses together, and you are still limited to 3.4 cm.
 
Re: Capturing Global Warming in One Simple Statistic

Strange is exactly right for that comment, long. Bizarre, really. You've completely ignored the very detailed analysis of accelerating sea level rise that I supplied to one of your denier buddies (Tim, I believe, but might have been "code") and created yet another false set of conditions and irrelevant side issues. Your claims now come pre-refuted but you refuse to look at the evidence.
So far you have not demonstrated the ability to even understand the most basic concepts in Science.
You seem to be stuck is parroting the party line from alarmist blogs.
The problems facing humanity will not be addressed by how much CO2 we emit.
Solving the real problem, energy will solve the others, real or imagined.
 
Re: Capturing Global Warming in One Simple Statistic

You should read up on the term significant figures, it means something.
Math Skills - Scientific Notation
The satellites only have an accuracy of 3.4 cm, any number reported more accurate than that is a guess.
Average 10,000 guesses together, and you are still limited to 3.4 cm.

Isn't funny how the warmists have the utmost trust in satellites that measure sea level but completely ignore satellites that measure atmospheric temperature?
 
Re: Capturing Global Warming in One Simple Statistic

I have always been operating under the assumption that words mean things. Could be wrong. However, projecting a scenario seems parallel to flying a launching pad.

From the IPCC:

Definition of terms

Projection
The term "projection" is used in two senses in the climate change literature. In general usage, a projection can be regarded as any description of the future and the pathway leading to it. However, a more specific interpretation has been attached to the term "climate projection" by the IPCC when referring to model-derived estimates of future climate.
Forecast/Prediction
When a projection is branded "most likely" it becomes a forecast or prediction. A forecast is often obtained using deterministic models, possibly a set of these, outputs of which can enable some level of confidence to be attached to projections.
Scenario
A scenario is a coherent, internally consistent and plausible description of a possible future state of the world. It is not a forecast; rather, each scenario is one alternative image of how the future can unfold. A projection may serve as the raw material for a scenario, but scenarios often require additional information (e.g., about baseline conditions). A set of scenarios is often adopted to reflect, as well as possible, the range of uncertainty in projections. Other terms that have been used as synonyms for scenario are "characterisation", "storyline" and "construction".
Scenario Family
One or more scenarios that have the same demographic, politico-societal, economic and technological storyline.
Storyline
A narrative description of a scenario (or a family of scenarios), highlighting the main scenario characteristics and dynamics, and the relationships between key driving forces.
Baseline/Reference
The baseline (or reference) is any datum against which change is measured. It might be a "current baseline", in which case it represents observable, present-day conditions. It might also be a "future baseline", which is a projected future set of conditions excluding the driving factor of interest. Alternative interpretations of the reference conditions can give rise to multiple baselines.
Exposure Unit
An exposure unit is an activity, group, region or resource exposed to significant climatic variations.

Content last modified: 17 June 2013

Yeah thanks for saving me the trouble of proving you wrong.
 
Re: Capturing Global Warming in One Simple Statistic

I have been trying to articulate in some way, why the higher end of the
predicted amplified feedback is so unlikely.
I built the following pie chart showing the total GISS warming since 1880,
along with the accepted sources of warming.
Total GISS warming .96 C
CO2 is 1.73*ln(398.55/290)= .55 C
TSI is (1.2/3.81)* (1361.34-1360.42)=.29 C
Adjustments, Pre 7/15 1880 to 2014 (.89 C), post 7/15 1880 to 2014 (.96 C) delta, .07 C
Balance = unknown = .05 C
Standard deviation for data set, .31 C.
warming%.webp
The point of the exercise, is showing the unknown portions of the warming are quite small.
 
Back
Top Bottom