- Joined
- Sep 15, 2013
- Messages
- 9,517
- Reaction score
- 5,001
- Location
- Australia
- Gender
- Male
- Political Leaning
- Liberal
When you add in the warming before 1950, which is acknowledged to be not AGW related, yes.
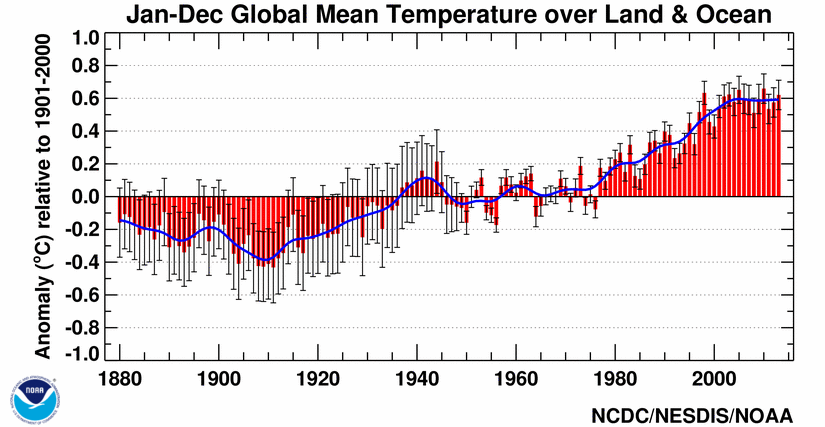
Look at your own graph, all the recent warming started in the 1979 to 1980 time frame.
I do wonder about your 5 year 1 month mean, was that the mean that cherry picked the best look?
Also on you graph see that big spike around 1940, with a 61 month mean, that is caused by the large temperature
increase I was talking about.
You can argue about the images, but the numbers tell a different story, even with GISS changing them often.
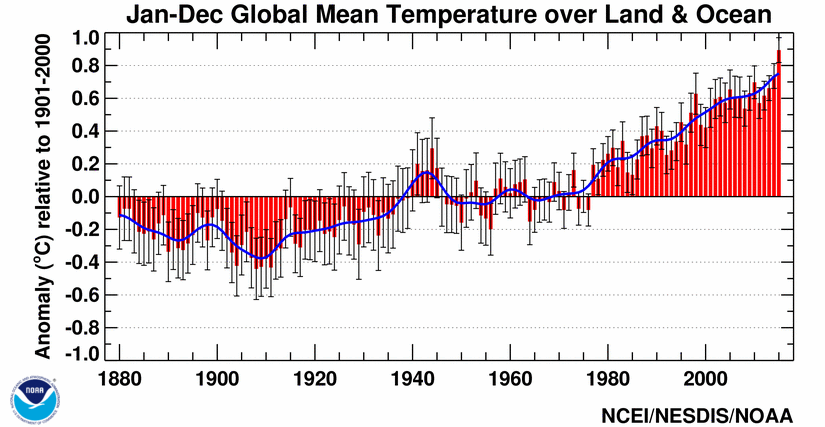
5 years is a pretty standard averaging scale for the instrumental record, enough to slightly smooth but not entirely remove ENSO and volcanic variations. But of course you'll whinge about that, even after cherry-picking your individual years (with different intervals between them to boot!). And for the record, humans didn't start using fossil fuels in 1950 :roll: I don't know whether you're trolling, or just don't realise that you're trapped in a ridiculous non-sequitur, but either way I think we're at a dead end until you respond intelligently to some or all of my earlier posts (#66, 60 and 58).