- Joined
- Jul 17, 2020
- Messages
- 35,185
- Reaction score
- 15,237
- Location
- Springfield MO
- Gender
- Male
- Political Leaning
- Liberal
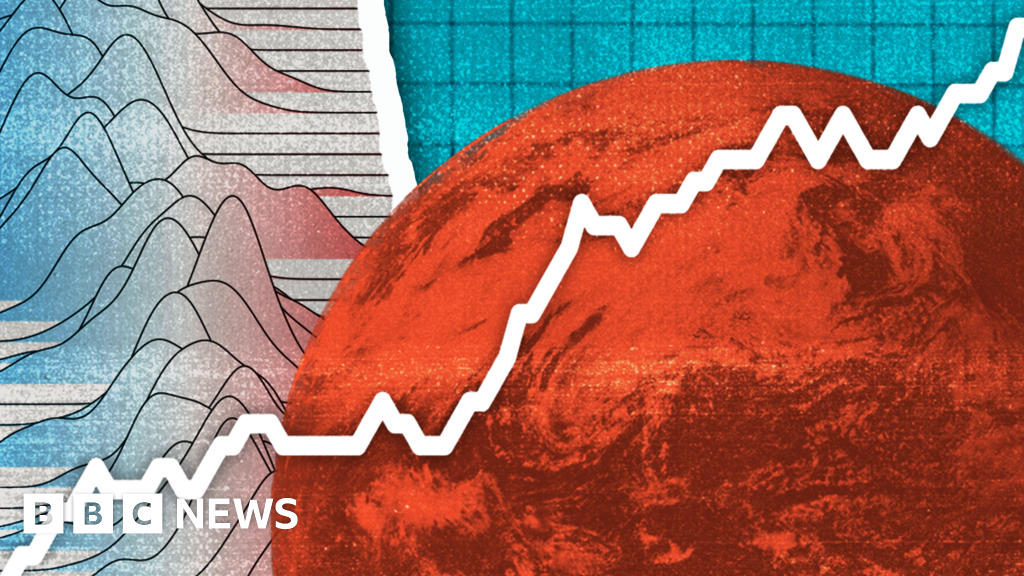
- 2023 set to be warmest year on record
- Greenhouse gas levels continue to increase
- Record sea surface temperatures and sea level rise
- Record low Antarctic sea ice
- Extreme weather causes death and devastation
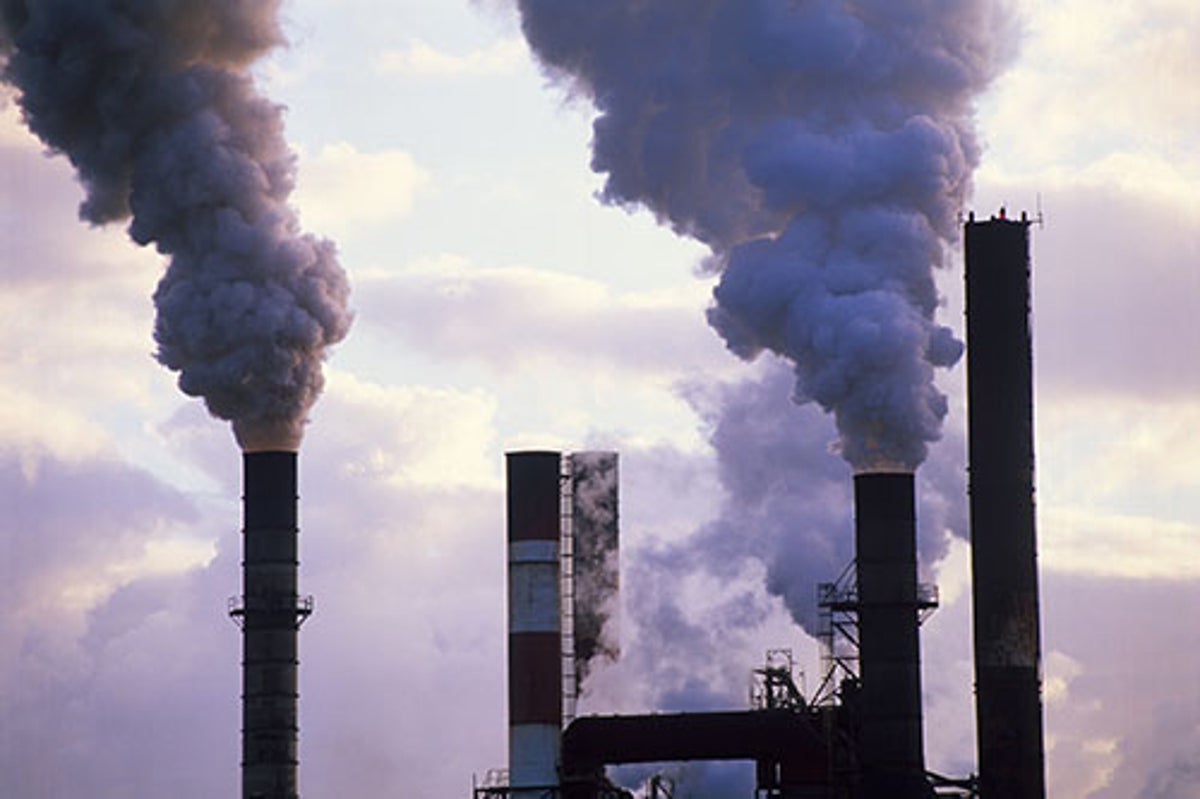
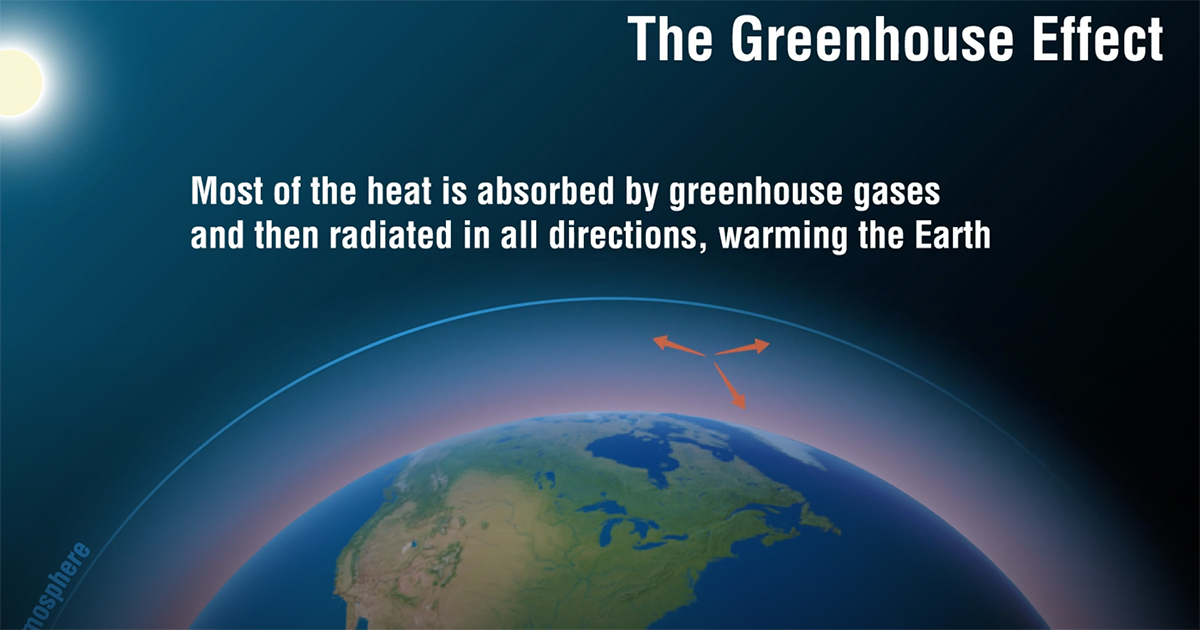
- Carbon dioxide levels are 50 % higher than the pre-industrial era, trapping heat in the atmosphere. The long lifetime of CO2 means that temperatures will continue to rise for many years to come.
The rate of sea level rise from 2013-2022 is more than twice the rate of the first decade of the satellite record (1993-2002) because of continued ocean warming and melting of glaciers and ice sheets.
The maximum Antarctic sea-ice extent for the year was the lowest on record, a full 1 million km2 (more than the size of France and Germany combined) less than the previous record low, at the end of southern hemisphere winter. Glaciers in North America and Europe once again suffered an extreme melt season. Swiss glaciers have lost about 10 percent of their remaining volume in the past two years, according to the WMO report.
Flooding associated with extreme rainfall from Mediterranean Cyclone Daniel affected Greece, Bulgaria, Türkiye, and Libya with particularly heavy loss of life in Libya in September.
Tropical Cyclone Freddy in February and March was one of the world’s longest-lived tropical cyclones with major impacts on Madagascar, Mozambique and Malawi. Tropical Cyclone Mocha, in May, was one of the most intense cyclones ever observed in the Bay of Bengal.
Extreme heat affected many parts of the world. Some of the most significant were in southern Europe and North Africa, especially in the second half of July where severe and exceptionally persistent heat occurred. Temperatures in Italy reached 48.2 °C, and record-high temperatures were reported in Tunis (Tunisia) 49.0 °C, Agadir (Morocco) 50.4 °C and Algiers (Algeria) 49.2 °C.

This information from the World Meteorological Organization