• This is a political forum that is non-biased/non-partisan and treats every person's position on topics equally. This debate forum is not aligned to any political party. In today's politics, many ideas are split between and even within all the political parties. Often we find ourselves agreeing on one platform but some topics break our mold. We are here to discuss them in a civil political debate. If this is your first visit to our political forums, be sure to check out the RULES. Registering for debate politics is necessary before posting. Register today to participate - it's free!

100 000 americans died in states run by Democrats

Correction of the previous post since I cannot edit it any more...

I meant to say..What I see more often is the claim that DESPITE the fact that the US enjoyed an advantage over most developed countries due to its low population density and younger population, it STILL ended up with one of the worst death rates among the developed nations and with the current thread, it will probably surpass even England.

Yes, that is ALMOST the claim that some of the innumerate members of "Claque Trump" make.

However the ACTUAL claim that they make is that

The US is ACTUALLY doing better than "Country X" because "Country X" has a lower (national) population density than the US has and that is why the numbers from "Country X" APPEAR to make it LOOK LIKE "Country X" is doing better than the US is.

(even though they may not express the claim in exactly those words).
 
Did you know that "Do you think that where you live is overcrowded?" and "What is the population density of where you live?" do NOT mean the same thing?

That is the "minor quibble" - NOT the "randomly selected person" part.

Asking a "randomly selected person" what their answer to "Do you think that where you live is overcrowded?" IS a "statistically valid" way of determining whether the "randomly selected person" THINKS that where they live is overcrowded - it is NOT a "statistically valid" way of determining what the population density of where that (untrained) person lives is.


See above.

Asking a randomly selected person if he thinks that his place is overcrowed was not how the study came to the number about the lived density in differetn states. So, you make things up.

From the link


We studied the 50 US States and District of Columbia, using figures of standard population density ρS taken from Wikipedia, and calculating the quadratic lived density ρQ
ourselves. The methodology for this calculation involved breaking the United States into
3,142 subareas (at the level of county, parish, borough or city). Population values were
available for each such subarea from the US census website [10], and the Wikipedia API
was used to find the land area for each region. Combining these values as described in
Definition 2.4 allowed us to find the value of ρQ for each state


where pQ is "the quadratic lived density"

In short, the numbers are not based on the result of some questionnaire asnwered by randomly selected people. It is based on mathematical calculations, and the claim is that these calculations express the average density as it is experienced by a randomly selected person.
 
Does democrats feel save living in states run by democrats?

Or is it easier to blame 100 000 american deaths on Trump?

Come on now, you know the mayors and governors have nothing they can do to stop the pandemic spread or the BLM and antifa violence in cities.
 
Really? You mean that if you count the number of red marbles and the number of white marbles in a bag of mixed marbles, you do not "prove" the number of red marbles and the number of white marbles that are in that bag of mixed marbles?

You do not need statistics for that. Simple counting is enough. You confuse how statistics are used in science, including social science...
 
Originally Posted by TU Curmudgeon

Then you haven't been reading the posts of some of the more innumerate members of "Claque Trump"

Oh, I have read many of them and I found them silly. But this is not relevant to the comment I addressed to you which was linked to the statistical study I posted which calculates the importance of lived population density in explaining a big part of the difference in death and infection rates we see among different places and the second study which links higher death rates and more serious infections to the virus load (which again is linked to the higher population density in big cities where infected patients get a higher load of virus from multiple other infected people).
 
I have absolutely no doubt that there is a strong correlation between "population density where lived" and "chance of contracting COVID-19" and (I believe) already said that. What I have my doubts about is using "a SUBJECTIVE OPINION from someone whose objective ability to accurately quantify 'X'" is a good OBJECTIVE MEASURE of 'X'.


See above.


Agreed, and I never said that it did. In fact, given a properly conducted study (i.e. one which uses actual census data on the census tracts and correlates that to the actual instances of COVID-19 infections and deaths) I would rather suspect that there would be quite a strong correlation between "specific area population density" and "specific area COVID-19 infections and deaths".

HOWEVER it makes even less sense to argue that the OBJECTIVE MEASURE of "National Population Density" explains it the way that the more innumerate members of "Claque Trump" propose.

[BTW, you do know that that actual census data on the census tracts is actually available and doesn't require asking anyone whether or not they THINK they live is a "crowded" (definition unknown) area or not? The failure to use actually available statistical data isn't QUITE -up- down there with using PIOOYA numbers, but it's headed in the same direction. In fact, it's just down right sloppy work.]

Obviously, you did not understand how the lived population density was calculated. Youn read the introduction and you assumed that they asked randomly chosen poeple to use some scale regarding if their area has high density or not. As I explained, and quoted, the lived population density was calculated mathematically using objective measures (see quote in post #252). The expression about the "randomly selected people" is meant to explain that the "lived population density that was calculated expressed the number of people who live on average within a square kilometer around a randomly selected person.
 
Last edited:
Yes, that is ALMOST the claim that some of the innumerate members of "Claque Trump" make.

However the ACTUAL claim that they make is that

The US is ACTUALLY doing better than "Country X" because "Country X" has a lower (national) population density than the US has and that is why the numbers from "Country X" APPEAR to make it LOOK LIKE "Country X" is doing better than the US is.

(even though they may not express the claim in exactly those words).

I assume that such claim is used by them to explain why Canada is doing better than the US in which case, they shoot themselves in the foot because they will not be able to explain the huge US failure when it is compared to European countries which have wayyyyyyy more national (and lived) population density.

What I am saying is that if one wants to make a case that Canada enjoys an advantage as a result of its lower population density (compared to the US), I am fine with it. Or in other words, if everything else is equal, a Canadian value of population density will give better results than the US value of population density. Or...if the US had Canada's population density and implemented the same lockdown/mask policies, it would have seen better results...or if Canada had the US level of population density, it would have seen worse results under the same policies.

Notice that I am not saying that ONLY population density matters. For example, a Canadian may argue that the elder (I think) Canadian population in general (you know, when you randomly pick Canadians and Americans to compare their age) gives also an advanatege to the US since 80% of coronovirus deaths strike those over 65 years old.

On the other hand I cannot find any serious advantages that European countries have over the US. They have older populations, higher population densities and had less time to prepare themselves since the pandemic hit them first. So, unlike the US, Italy did not suspect the serious danger of experiencing vendilator shorrtages until it was too late. And the doctors there had wayyyyy less knowledge about the most effective available treatment that was available in the absence of the vaccine.
 
Last edited:
Do Democrats feel safe living in states run by Democrats?

Or is it easier to blame 100 000 American deaths on Trump?

Fixed it for you. Learn how to write basic English before asking more questions.

You are asking two separate questions here. I feel safe where I live because it is not a huge metropolis. If I lived in the Miami area, I would do anything to get out of there.

Democrats blame many people for the pandemic, but you have to be an ostrich to believe Donald Trump is not responsible. People who keep their heads out of the sand pay attention to all the proven facts that fully support the American people.
 
You do not need statistics for that. Simple counting is enough. You confuse how statistics are used in science, including social science...

You are obviously using a definition for "statistics" that is one I have never heard of since it doesn't appear to include hard data as part of "statistics".
 
I assume that such claim is used by them to explain why Canada is doing better than the US in which case, ...

That's the most common one.

... they shoot themselves in the foot because they will not be able to explain the huge US failure when it is compared to European countries which have wayyyyyyy more national (and lived) population density.

Of course they don't "shoot themselves in the foot". What they do is simply ignore that fact.

What I am saying is that if one wants to make a case that Canada enjoys an advantage as a result of its lower population density (compared to the US), I am fine with it. Or in other words, if everything else is equal, a Canadian value of population density will give better results than the US value of population density. Or...if the US had Canada's population density and implemented the same lockdown/mask policies, it would have seen better results...or if Canada had the US level of population density, it would have seen worse results under the same policies.

Which, of course, is pretty much what

20-09-08 A4 - G8+China NORMALIZED.jpg

20-09-08 B3 - Death by Ability to Pay.jpg

20-09-08 Z6 - Current SPOT Daily Death Ratios.jpg

and

20-09-08 Z7 - Mortality vs Tests.JPG

establish.

Notice that I am not saying that ONLY population density matters. For example, a Canadian may argue that the elder (I think) Canadian population in general (you know, when you randomly pick Canadians and Americans to compare their age) gives also an advanatege to the US since 80% of coronovirus deaths strike those over 65 years old.

I never claimed that you WERE saying that "ONLY population density matters".

On the other hand I cannot find any serious advantages that European countries have over the US. They have older populations, higher population densities and had less time to prepare themselves since the pandemic hit them first. So, unlike the US, Italy did not suspect the serious danger of experiencing vendilator shorrtages until it was too late. And the doctors there had wayyyyy less knowledge about the most effective available treatment that was available in the absence of the vaccine.

In short, some European countries healthcare systems were almost swamped before they could actually come to grips with COVID-19. If you look at Column 4 in the second table above, you will see that even Italy and the UK are now within ±5% of the US (and gaining).
 
Thanks for that dose of reality. Watch it being studiously ignored by the usual suspects.

It's a bit difficult to read it (and I haven't yet figured out how to make the tables bigger so that they are easier to read, so here's the summary block for the first table.

20-09-08 D1a - Red vs Blue States - SUMMARY.JPG

PS - I dearly do love those who are so desperate/innumerate as to believe that the US has had over 6,000,000 people RECOVER from COVID-19.

20-09-08 Z5 - Top Three for Recoveries.JPG
 
You are obviously using a definition for "statistics" that is one I have never heard of since it doesn't appear to include hard data as part of "statistics".

Arithmetry and counting is part of statistics but it is a distortion to try to equate statistics with basic counting.
 
Here is the table as of today (with the caveat that the identification of Red and Blue states is the one used by Vaughn's Summaries using the 2016 election results. Any changes to the alignments of states to bring them into a more current listing would be appreciated.


[NOTE - I think that the state numbers are current.]

The "Blue States" with 43.09% of the population have 39.80% of the total cases and 54.59% of the total deaths.

The "Red States" with 56.91% of the population have 60.20% of the total cases and 45.41% of the total deaths.

Since the US has a "Clearance Rate" (Column 7)


of only 59.91% that means that increases in deaths actually lags increases in cases so I would expect that the percentages for total deaths would most likely be less unfavourable for the "Blue States" and less favourable for the "Red States".

Since it appears that it is the "Red States" which are seeing the greatest increases in new cases, I rather suspect that the percentages for total cases will continue to improve for the "Blue States" and will continue to deteriorate for the "Red States".
Thanks for the efforts, TU Curmudgeon.

Yes, that seems to support what we believe we are seeing.
 
Arithmetry and counting is part of statistics but it is a distortion to try to equate statistics with basic counting.

"Counting" = "data".

"Statistics" ≠ "statistical analysis".
 
If you had been following along, you would already have the answer to your question.

She got them from a post of mine, and a post in which I got the numbers backwards - which I have already admitted.

You might also have seen the subsequent posts from me in which those numbers were reversed, but, in case you haven't,


Because the summary block is a bit difficult to read, here (slightly modified in layout) it is again with larger typeface


As you can see

  1. - as the situation exists RIGHT NOW, the "Blue States" have LESS than their proportionate share of cases (which means that the "Red States" have MORE than their proportionate share of cases);
    *
    and
    *
  2. - as the situation exists RIGHT NOW, the "Blue States have MORE than their proportionate share of deaths (which means that the "Red States" have LESS than their proportionate share of cases).

However, if you look at the CURRENT TRENDS in the several states, you can also see that - if those trends continue unchanged - Item 1 above is NOT likely to change BUT Item 2 above is likely to change.


What you should also consider is that the "Blue State" have had longer than the "Red States" to build up their "stocks" of cases and deaths. It might be interesting to see some (verifiable) data on "Average number of cases per day since first case" and "Average number of deaths per day since first death" on a state by state basis, but I have neither the time nor the inclination to devote the necessary energy to chasing those down.

I was asking for the source.
A link to the site, or the group that compiled this data.
 
I was asking for the source.
A link to the site, or the group that compiled this data.

Then I suggest that you take a look at the daily update of the COVID-19 data that is available at Daily Statistical Summary of COVID-19 since both of your questions are answered there.

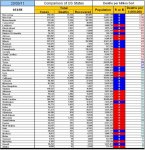
By the way, here is today's table

20-09-11 D1 - Red vs Blue States - Alphabetical.jpg

and here is a repeat of the summary portion

20-09-11 D1a - Red vs Blue States - SUMMARY.JPG

which differs only in that I have updated the formatting so that the numbers that are 5+% better than the base are in GREEN, the numbers that are ±5% of the base are in BLUE, and the numbers that are 5+% worse than the base are in RED.

You might also find this table interesting

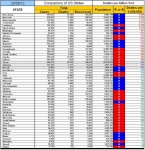
20-09-11 D2 - Red vs Blue States - Death per Million.jpg

but that would only be if you are actually interested in hard (well, as hard as is available) data.
 
Then I suggest that you take a look at the daily update of the COVID-19 data that is available at Daily Statistical Summary of COVID-19 since both of your questions are answered there.

By the way, here is today's table


and here is a repeat of the summary portion


which differs only in that I have updated the formatting so that the numbers that are 5+% better than the base are in GREEN, the numbers that are ±5% of the base are in BLUE, and the numbers that are 5+% worse than the base are in RED.

You might also find this table interesting


but that would only be if you are actually interested in hard (well, as hard as is available) data.

The only thing I find interesting here is how desperate you are to keep reposting this trash and not actually addressing what the standard is.

Nor what is actually being compiled, or how it's being gathered. Because even the site states that it's data is not collected through fully official sources.
 
The only thing I find interesting here is how desperate you are to keep reposting this trash and not actually addressing what the standard is.

Yes, I am fully aware that the latest version of the currently operative, officially sanctioned, "Team Trump" approved, White House issued, truth-of-the-day is

Anything I don't want to hear (and that means anything that isn't 100% in accord with what Donald Trump says **T*H*E** **T*R*U*T*H** is (today) is 'trash'.

I just don't happen to be mindless enough to automatically subscribe to it when it conflicts with reality.

The reality is

20-09-12 D1a - Red vs Blue States - SUMMARY.JPG

and that shows that the "Red States" are rapidly making up for their lagging behind in having their citizens contract COVID-19.

The reality is also

20-09-12 D2 - Red vs Blue States - Death per Million.jpg

Nor what is actually being compiled, or how it's being gathered. Because even the site states that it's data is not collected through fully official sources.

Yes, I acknowledge that the latest version of the currently operative, officially sanctioned, "Team Trump" approved, White House issued, truth-of-the-day is

Any data that isn't 1,000,000% 'OFFICIALLY VERIFIED' is to be completely disregarded especially if it isn't 1,000,000% in accord with what Donald Trump says **T*H*E** **T*R*U*T*H** is (today).

I just don't happen to be mindless enough to automatically subscribe to it when it conflicts with reality.

You might not like the fact that (with the exception of the United Kingdom) Americans have a greater chance of dying from COVID-19 than does anyone in the "G-8+China" group, and a greater chance of dying from COVID-19 than does anyone in the whole world (on an aggregated basis) AND that is even without taking into consideration the relative financial abilities of the listed areas to be able to fund the fight against COVID-19 AND that is also even without taking into consideration the relative amounts that the listed areas were spending on their healthcare systems.

20-09-12 B3 - Death by Ability to Pay.jpg

One would really expect that the wealthiest nation, with the healthcare system that was the most highly funded, would be the one with the LOWEST number of deaths per million, the LOWEST number of cases per million, and the HIGHEST recovery rate.

So, just ask yourself

  1. "Does the US have the LOWEST number of deaths per million, and, if not, why not?"
    *
  2. "Does the US have the LOWEST number of cases per million, and, if not, why not?"
    *
  3. "Does the US have the HIGHEST recovery rate?" and, if not, why not?"

and try to be honest with yourself.
 
Yes, I am fully aware that the latest version of the currently operative, officially sanctioned, "Team Trump" approved, White House issued, truth-of-the-day is

Anything I don't want to hear (and that means anything that isn't 100% in accord with what Donald Trump says **T*H*E** **T*R*U*T*H** is (today) is 'trash'.

I just don't happen to be mindless enough to automatically subscribe to it when it conflicts with reality.

The reality is


and that shows that the "Red States" are rapidly making up for their lagging behind in having their citizens contract COVID-19.

The reality is also


Yes, I acknowledge that the latest version of the currently operative, officially sanctioned, "Team Trump" approved, White House issued, truth-of-the-day is

Any data that isn't 1,000,000% 'OFFICIALLY VERIFIED' is to be completely disregarded especially if it isn't 1,000,000% in accord with what Donald Trump says **T*H*E** **T*R*U*T*H** is (today).

I just don't happen to be mindless enough to automatically subscribe to it when it conflicts with reality.

You might not like the fact that (with the exception of the United Kingdom) Americans have a greater chance of dying from COVID-19 than does anyone in the "G-8+China" group, and a greater chance of dying from COVID-19 than does anyone in the whole world (on an aggregated basis) AND that is even without taking into consideration the relative financial abilities of the listed areas to be able to fund the fight against COVID-19 AND that is also even without taking into consideration the relative amounts that the listed areas were spending on their healthcare systems.


One would really expect that the wealthiest nation, with the healthcare system that was the most highly funded, would be the one with the LOWEST number of deaths per million, the LOWEST number of cases per million, and the HIGHEST recovery rate.

So, just ask yourself

  1. "Does the US have the LOWEST number of deaths per million, and, if not, why not?"
    *
  2. "Does the US have the LOWEST number of cases per million, and, if not, why not?"
    *
  3. "Does the US have the HIGHEST recovery rate?" and, if not, why not?"

and try to be honest with yourself.

And your desperation continues.
 
And your desperation continues.

I posted:

So, just ask yourself

  1. "Does the US have the LOWEST number of deaths per million, and, if not, why not?"
    *
  2. "Does the US have the LOWEST number of cases per million, and, if not, why not?"
    *
  3. "Does the US have the HIGHEST recovery rate?" and, if not, why not?"

and try to be honest with yourself.

Either you are:

  • unable to answer those questions;
    *
  • embarrassed to answer those questions;
    *
  • afraid to find out what the answers to those questions are;
    *
  • lying to yourself about what the answers to those questions are;
    *
  • unable to be honest;
    *
    or
    *
  • some combination of two or more of the above (depending on which question).

Today's data shows

20-09-15 A1 - G8 + CHINA COVID.jpg

20-09-15 A3 - Comparison of Ratios.jpg

20-09-15 Z6 - Current SPOT Daily Death Ratios.jpg

20-09-15 B3 - Death by Ability to Pay.jpg

20-09-15 D1a - Red vs Blue States - SUMMARY.JPG

no matter how much you don't want to admit it to yourself, and

  1. the US ranks as the 205[sup]th[/sup] worst (out of 215) for the number of cases per million;
    *
  2. the US ranks as the 205[sup]th[/sup] worst (out of 215) for the number of deaths per million;
    *
  3. the US is doing worse than 94.88% of all of the world's countries in dealing with COVID-19;
    *
    and
    *
  4. the ONLY major country in the world where you have a worse chance of dying from COVID-19 is the UK (however, if the current trends continue, the UK isn't likely to "enjoy" that "distinction" for much longer than a week);

REGARDLESS of what Mr Trump and "Claque Trump" are telling you and regardless of how much you want to refuse to recognize reality.
 
Back
Top Bottom