• This is a political forum that is non-biased/non-partisan and treats every person's position on topics equally. This debate forum is not aligned to any political party. In today's politics, many ideas are split between and even within all the political parties. Often we find ourselves agreeing on one platform but some topics break our mold. We are here to discuss them in a civil political debate. If this is your first visit to our political forums, be sure to check out the RULES. Registering for debate politics is necessary before posting. Register today to participate - it's free!

RE and GWP Explained

Except that your cited page said the high levels of Ld, were all calculated not measured.
To calculate global mean Ld, biases of these Ld estimates were removed if found from the evaluations. Substantially different global averages of Ld have been reported, such as 345−350 W m−2 from satellite remote retrievals [Gupta et al., 1999; Stephens et al., 2012a, 2012b], 342−345 W m−2 from bias-corrected GCM simulations [Wild et al., 2001, 1998, 2013], and 324 W m−2 [Kiehl and Trenberth, 1997] or 333 W m−2 with a residual method [Trenberth et al., 2009].
Ld is longwave downwards radiation. The GCM simulations that the IPCC uses are bias corrected from measured observations. All of the values you mention above either measured or calculated are far above the 240 that you say is the most they can be.


I had to go all the way back to Kiehl and Trenberth, 1997 to find where this casual high number came from.
Earth’s Annual Global Mean Energy Budget
Here we assume a “solar constant” of 1367 W m−2 (Hartmann 1994), and because the incoming solar radiation
is one-quarter of this, that is, 342 W m−2 , a planetary albedo of 31% is implied.
The 342 you cite here is incoming solar radiation, not Ld.


This is not something that they measured or observed!
They calculated it from the solar constant which is measured. There is no problem with the calculation. See below at end.

The greenhouse effect is simply that an energy imbalance exists that makes Earth warmer than it would be if the atmosphere
were completely transparent. The imbalance is between ASR, and OLR, (ASR includes reflected shortwave radiation.)
I don’t believe that absorbed solar radiation includes reflected shortwave (solar) radiation. They are shown separately.

IMG_0461.webp

Where I suspect the diagrams have it wrong is that many show Absorbed sunlight as being at the top of the atmosphere
as opposed to surface where ASR is actually happening,
The only diagrams I have seen show some sunlight being absorbed by the atmosphere but most at the surface as above. What diagrams are you referring to?


TOA sunlight is over 1300 W m-2
The approximately circular disc of the Earth, as viewed from the Sun, receives a roughly stable 1361 W/m2 at all times. The area of this circular disc is πr2, in which r is the radius of the Earth. Because the earth is approximately spherical, it has total area
{\displaystyle 4\pi r^{2}}
, meaning that the solar radiation arriving at the top of the atmosphere, averaged over the entire surface of the Earth, is simply divided by four to get 340 W/m2. In other words, averaged over the year and the day, the Earth's atmosphere receives 340 W/m2 from the Sun.
 
Ld is longwave downwards radiation. The GCM simulations that the IPCC uses are bias corrected from measured observations. All of the values you mention above either measured or calculated are far above the 240 that you say is the most they can be.


The 342 you cite here is incoming solar radiation, not Ld.


They calculated it from the solar constant which is measured. There is no problem with the calculation. See below at end.


I don’t believe that absorbed solar radiation includes reflected shortwave (solar) radiation. They are shown separately.

View attachment 67573928


The only diagrams I have seen show some sunlight being absorbed by the atmosphere but most at the surface as above. What diagrams are you referring to?


The approximately circular disc of the Earth, as viewed from the Sun, receives a roughly stable 1361 W/m2 at all times. The area of this circular disc is πr2, in which r is the radius of the Earth. Because the earth is approximately spherical, it has total area
{\displaystyle 4\pi r^{2}}
, meaning that the solar radiation arriving at the top of the atmosphere, averaged over the entire surface of the Earth, is simply divided by four to get 340 W/m2. In other words, averaged over the year and the day, the Earth's atmosphere receives 340 W/m2 from the Sun.
What you are not following is that in the drawing above The 398 W m-2 thermal up surface, and 342 W m-2 thermal down surface are not actually
measured anywhere, they are simply a calculated guess.
Consider this, The Baseline Surface Radiation Network (BSRN) records both shortwave and longwave radiation.
From Dimming to Brightening: Decadal Changes in Solar Radiation at Earth’s Surface
Note the Y-Axes values, do you think 342 W m-2 of thermal down somehow escaped being recorded?
We should not forget that The Y-Axes already includes the 161 W m-2 of Solar absorbed Surface in the drawing!
1749583698400.webp
 
You will have to explain this a little if you want people to understand it.

First if the solar radiation arriving at the top of the atmosphere, averaged over the entire surface of the Earth, is only 340, how do we get to 500 at the surface? Are you talking about 500 solar at the surface?

Second 500 sounds high to me if you are working from the 1000. I can see getting to 500 if you account for only day vs night by dividing in half but even there that 1000 is only at “high noon” and it rises to that from dawn and declines from that to dusk then there is darkness for half the 24 hour period. Also, the 90 degree zenith is only ever reached up to 23.5 degrees of latitude and only for 2 days a year. All other days never reach 90 degrees and latitudes higher than 23.5 never reach the 90 degree zenith. At the poles the maximum is a 23.5 degree angle which would only be about 400 W/m^2 and that for only 2 days per year at the maximum each day.
What you are speaking of would most certainly be true at the TOA. The net energy would be zero if the earth is maintaining the same heat. If the earth system has more energy coming in than leaving, the earth system is gaining heat. More energy leaving and the earth system loses heat. This is true at the TOA, and that heat changes are a combination of chemical changes, molecular state changes, and temperature changes.

I don't understand what you are seeing if you are not allowing for the 500 average at the surface. This is heat that was not allowed to directly leave. Accumulated heat works like anything else. A simple example you be filling a glass with a hole in the side. With a large enough hole, the water you fill with maintains to where it can escape. If you make it a smaller hole, the level in the glass has to rise above the hole until it achieves enough pressure to escape at the same rate the glass is filled and we have equilibrium. The values for heat accumulation work the same way. Make the hole smaller yet, and the level has to rise even higher to achieve a pint where it can escape fast enough.
 
The approximately circular disc of the Earth, as viewed from the Sun, receives a roughly stable 1361 W/m2 at all times.
Over the annual average, this is true, but it still varies as well. Some studies have the long term variation of the solar constant by arounf 0.3%. Then if you want seasonal accuracy, you must consider the Earth's eccentricity.

Then the eccentricity of the earth currently at over 0.3. The Aphelion of the earth is 152,097,597 km, while the Perihelion is 147,098,450 km. This ratio is 1.033985. Using the inverse square law and the 1361, early January the earth is the closest to the sun and the energy would be 1,384 W/m^1 at the TOS. Early July only 1.338 W/m^2.
The area of this circular disc is πr2, in which r is the radius of the Earth. Because the earth is approximately spherical, it has total area
{\displaystyle 4\pi r^{2}}
, meaning that the solar radiation arriving at the top of the atmosphere, averaged over the entire surface of the Earth, is simply divided by four to get 340 W/m2. In other words, averaged over the year and the day, the Earth's atmosphere receives 340 W/m2 from the Sun.
Yep. This is why the average is said to be 1/4 the full.
 
What you are not following is that in the drawing above The 398 W m-2 thermal up surface, and 342 W m-2 thermal down surface are not actually
measured anywhere, they are simply a calculated guess.
Yes, and they have a wide margin of error.
Consider this, The Baseline Surface Radiation Network (BSRN) records both shortwave and longwave radiation.
From Dimming to Brightening: Decadal Changes in Solar Radiation at Earth’s Surface
Note the Y-Axes values, do you think 342 W m-2 of thermal down somehow escaped being recorded?
We should not forget that The Y-Axes already includes the 161 W m-2 of Solar absorbed Surface in the drawing!
View attachment 67573938
Yes, the 161 minus the latent heat is part of that 398 upward. 161 - (84+20) = 57; 398 - 57 = 341. 1 remaining for the 0.6 surface imbalance. More accurately, the solar and downward would be equal to 503 (161 + 342.) for the surface heat received as they will both contribute to the latent heat of 104 (84 + 20) and the both contribute to the thermal up of 398. The latent heat and thermal upward equals 502 (84 + 20 + 398.)
 
Yes, and they have a wide margin of error.

Yes, the 161 minus the latent heat is part of that 398 upward. 161 - (84+20) = 57; 398 - 57 = 341. 1 remaining for the 0.6 surface imbalance. More accurately, the solar and downward would be equal to 503 (161 + 342.) for the surface heat received as they will both contribute to the latent heat of 104 (84 + 20) and the both contribute to the thermal up of 398. The latent heat and thermal upward equals 502 (84 + 20 + 398.)
But the 502 w m-2 is not actually measured anywhere, it is assumed. At least I have not seen any references where it is measured.
 
Yes, and they have a wide margin of error.

Yes, the 161 minus the latent heat is part of that 398 upward. 161 - (84+20) = 57; 398 - 57 = 341. 1 remaining for the 0.6 surface imbalance. More accurately, the solar and downward would be equal to 503 (161 + 342.) for the surface heat received as they will both contribute to the latent heat of 104 (84 + 20) and the both contribute to the thermal up of 398. The latent heat and thermal upward equals 502 (84 + 20 + 398.)
Now I follow. You are talking about both downward solar and longwave. That’s why I asked if you were talking solar only which didn’t make sense to me.
 
What you are not following is that in the drawing above The 398 W m-2 thermal up surface, and 342 W m-2 thermal down surface are not actually
measured anywhere, they are simply a calculated guess.
Actually, they are measured at various places for example:

IMG_0470.webp

Consider this, The Baseline Surface Radiation Network (BSRN) records both shortwave and longwave radiation.
From Dimming to Brightening: Decadal Changes in Solar Radiation at Earth’s Surface
Note the Y-Axes values, do you think 342 W m-2 of thermal down somehow escaped being recorded?
They are recorded as per above. They are also recorded at BSRN but the drawing tool I saw for BSRN only had the option to show a day at a time.

If you read the caption in your graph below you will see that the BSRN graphs are only surface solar (shortwave) radiation. That’s why they don’t show longwave.

We should not forget that The Y-Axes already includes the 161 W m-2 of Solar absorbed Surface in the drawing!
View attachment 67573938
 
But the 502 w m-2 is not actually measured anywhere, it is assumed. At least I have not seen any references where it is measured.
Yes, it is assumed. I started looking at spectral calc. the 288K earth average at 1 emmisivity radiates 390.115 W/m^2. This threw me at first, but we need to do a geometric average since temperature to energy is not linear. Effectively the temperature at each latitude and area, then averages. Still, the 396 seems high because the emissivity is around a 0.9 average for the earth. I think I have resolved this discrepancy in the past, but I do not remember for certain. Now I am questioning myself the high levels in the graph. It does seem unrealistic.
 
Now I follow. You are talking about both downward solar and longwave. That’s why I asked if you were talking solar only which didn’t make sense to me.
Since both heat the surface, both are responsible for upward heat. Further differences occur by surface type and land or water. An energy graph is a bit simplistic.

Water absorbs a vast majority of the solar changes, but very little of any added longwave. The skin layer of water vapor already has it effectively saturated. I forget the spectral absortion of vegitation, sand, etc. But in their absorption of longwave and shortwave have different values. What in not absorbed is reflected and there is emissivity as well. Water is among the highest thermal emitters at around 0.95 emissivity and also carries heat away via evaporation.

The energy graphs we see here are very simplified compared to the real world heat exchange.
 
Actually, they are measured at various places for example:

View attachment 67573989


They are recorded as per above. They are also recorded at BSRN but the drawing tool I saw for BSRN only had the option to show a day at a time.

If you read the caption in your graph below you will see that the BSRN graphs are only surface solar (shortwave) radiation. That’s why they don’t show longwave.
Thanks for finding the site.
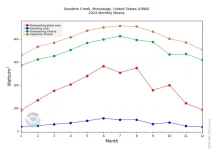
It is interesting that the IR cycling around is greater than the incoming solar.
SURFRAD Monthly Mean Radiation Plot
1749639735800.webp
The site does show how the downwelling IR can be so high, while the incoming solar is lower, They are both averaged
over the 24 hour day. It is more obvious from the daily graph.
In Physics there is no such thing as a free lunch, for there to be the amount of energy stated, it had to be coming from somewhere.
SURFRAD Radiation Plot
1749640082454.webp
 
Back
Top Bottom