• This is a political forum that is non-biased/non-partisan and treats every person's position on topics equally. This debate forum is not aligned to any political party. In today's politics, many ideas are split between and even within all the political parties. Often we find ourselves agreeing on one platform but some topics break our mold. We are here to discuss them in a civil political debate. If this is your first visit to our political forums, be sure to check out the RULES. Registering for debate politics is necessary before posting. Register today to participate - it's free!

RE and GWP Explained

Lord of Planar

Supporting Member
DP Veteran
Monthly Donator
Joined
Dec 22, 2012
Messages
79,173
Reaction score
26,971
Location
Portlandia
Gender
Male
Political Leaning
Libertarian - Right
RE (Radiative Efficiency) and GWP (Global Warming Potential) explained. I consider both RE and GWP nonsensical metrics for studying the climate system regarding greenhouse gasses. This is because the values are a linearized value between two points on a log curve and grow in error very fast.

RE is seen in the tables as to its calculation. It is the forcing value difference with 1 ppb (part per billion) of gas added. This makes it a slope of the graph between the gas levels and forcing levels of the two points. Because this is a linear slope, it does not follow the log curve, and this makes it an unrealistic metric to use.

GWP is similar, except it uses a kilogram added to the starting gas level instead of a ppb. Since CH4 has a molar mass of 16, and CO2 a molar mass of 44, the metric is using 2.75 time CH4 as CO2 for comparisons.

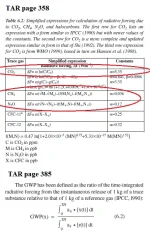
Here is what the IPCC uses for the greenhouse formulas. It is found on page 358 of the TAR (Third Assessment Report) WG1 (Working Group 1). I circled the formulas from Table 6.2 that I used to make the graph. GWP formula and explanation is found on page 385 of the TAR.

The graph I presented matches the numbers for RE as found in Table 2.1 of the AR5 (5th Assessment report). Table 8.A.1 has N2O at a different RE, which really bugs me about the IPCC. They have errors found now and again. I included it because it shows the GWP numbers for the AR5.
1734727379450.png

1734727587360.png

Here is the graph that I made using the IPCC AR5 WG1 numbers, and formula found in the TAR WG1:

1734727414538.png

Now look at the numbers also. My RE slopes are 1000 times greater than the RE values of the IPCC. That is because I graphed the X-Axis in ppm (parts per million) instead of ppb (parts per billion). They are otherwise the same. Small changes will matter little so I will show the connection between RE and GWP. We will start by using RE of CO2 and CH4. 3.63e-4 / 1.37e-5 = 26.5. Since GWP uses mass instead of volume, we multiply this by the mass ratio of the two molecules, or 2.75. 26.5 x 2.75 = 72.9. This is close to the GWP of 84 used by the IPCC for the 20 year horizon.

Note the scaling between the gasses on the graph. At equal levels, CO2 is much greater than CH4. Notice that the RE trend lines fall away from the actual gas curve very quickly. It is a lie to say the CH4 is the stronger greenhouse gas. It just has a greater forcing increase per the same amount of added gas.

Don’t let the scare tactic of using GWP affect you. It has no real meaning.

Any questions?
 
I have a question.

Ever actually talked to a real climate scientist?

Ever?

Ever attended a scientific conference and presented your ideas, and do you have
Even the faintest idea of what the opposing views might be and how to counter them?
 
I have a question.

Ever actually talked to a real climate scientist?

Ever?

Ever attended a scientific conference and presented your ideas, and do you have
Even the faintest idea of what the opposing views might be and how to counter them?
Why does that matter regarding understanding of the material?

I have done nothing new. Only shown how the math relates. Can you follow what I did?
 
RE (Radiative Efficiency) and GWP (Global Warming Potential) explained. I consider both RE and GWP nonsensical metrics for studying the climate system regarding greenhouse gasses. This is because the values are a linearized value between two points on a log curve and grow in error very fast.

RE is seen in the tables as to its calculation. It is the forcing value difference with 1 ppb (part per billion) of gas added. This makes it a slope of the graph between the gas levels and forcing levels of the two points. Because this is a linear slope, it does not follow the log curve, and this makes it an unrealistic metric to use.

GWP is similar, except it uses a kilogram added to the starting gas level instead of a ppb. Since CH4 has a molar mass of 16, and CO2 a molar mass of 44, the metric is using 2.75 time CH4 as CO2 for comparisons.

Here is what the IPCC uses for the greenhouse formulas. It is found on page 358 of the TAR (Third Assessment Report) WG1 (Working Group 1). I circled the formulas from Table 6.2 that I used to make the graph. GWP formula and explanation is found on page 385 of the TAR.

The graph I presented matches the numbers for RE as found in Table 2.1 of the AR5 (5th Assessment report). Table 8.A.1 has N2O at a different RE, which really bugs me about the IPCC. They have errors found now and again. I included it because it shows the GWP numbers for the AR5.

View attachment 67547817

View attachment 67547819

Here is the graph that I made using the IPCC AR5 WG1 numbers, and formula found in the TAR WG1:

View attachment 67547818

Now look at the numbers also. My RE slopes are 1000 times greater than the RE values of the IPCC. That is because I graphed the X-Axis in ppm (parts per million) instead of ppb (parts per billion). They are otherwise the same. Small changes will matter little so I will show the connection between RE and GWP. We will start by using RE of CO2 and CH4. 3.63e-4 / 1.37e-5 = 26.5. Since GWP uses mass instead of volume, we multiply this by the mass ratio of the two molecules, or 2.75. 26.5 x 2.75 = 72.9. This is close to the GWP of 84 used by the IPCC for the 20 year horizon.

Note the scaling between the gasses on the graph. At equal levels, CO2 is much greater than CH4. Notice that the RE trend lines fall away from the actual gas curve very quickly. It is a lie to say the CH4 is the stronger greenhouse gas. It just has a greater forcing increase per the same amount of added gas.

Don’t let the scare tactic of using GWP affect you. It has no real meaning.

Any questions?
Ok... you have shown that the radiative efficiency of CH4 is 26.5 times that of CO2. So how can you claim that CO2 is a stronger GHG than methane?

And how can you plot CH4 on a graph that is in ppm when CH4 is measured in ppb?
 
Ok... you have shown that the radiative efficiency of CH4 is 26.5 times that of CO2.
Yes. The value for CH4 RE the way it is calculated at those levels of a gas is much greater than CO2. It is on a steeper area of a log curve.
So how can you claim that CO2 is a stronger GHG than methane?
These are at two different levels of a gas, and RE decreases as the level of the gas increases. In the AR4 using 379 ppm, the RE was 1.41e-5, and as the increases in the AR5 it decreases to 1.37e-5.

If I tell Excel, using the IPCC formulas to place all three gasses I have listed at 200 ppm, then I get this:

1734772616088.webp

Now CO2 has an RE of more than five times that of CH4.

RE tells us how much one added ppb increases the forcing to the existing amount of the gas. It does not tell us the absolute forcing of the gas. That is all it does. It has no practical use at the scale of increases we see. It is unreal since it loses accuracy fast. GWP is unreal for the same reason.

At equal levels, CO2 is the greater greenhouse gas. Their height in the graph is a visual representation of the forcing at a given level.
And how can you plot CH4 on a graph that is in ppm when CH4 is measured in ppb?
1,000 ppb = 1 ppm. It is just that simple. The CH4 value in the AR5 is 1,803 ppb. I used 1.803 for the calculation. It is no different than calling 1,803 grams 1.803 kilograms.

I could have made the graph in ppb, but then the numbers on the X-axis would be 1,000 times larger.
 
Here is my CH4 formula in excel from the TAR WG1 page 358, if you want to find a mistake in it:

=R$2*(SQRT($B53)-SQRT(R$8))-((0.47*LN(1+0.0000201*(R$5*$B53)^0.75+0.00000000000000531*$B53*($B53*R$5)^1.52)-(0.47*LN(1+0.0000201*(R$5*R$8)^0.75+0.00000000000000531*R$8*(R$8*R$5)^1.52))))

Cells:

R2 is the 0.036 constant.

R5 is the N2O level stated in the AR5 in ppb. Set to 324.

R8 is the CH4 level in the AR5. Set to 1803.

B53 is the reverence starting pint in the data of 1.803 ppm, or 1,803 ppb. Column A is the X-Axis data in ppm, column B is 1,000 time greater to represent ppb.
 
Notice I have three curve descriptions for each gas. The named gas is the slope of the curve of forcing vs. volume. The one with "slope" added is only two points. The current gas level and the added 1 ppb to determine a slope, IAW the IPCC method. The dotted line with "radiative efficiency slope" is the excel calculated trend-line of the two points.
 
If we look at this from a different angle, we get different results yet. The AR5 has CO2 increased from 278 ppm to 390.48 ppm. The accompanied forcing increase is 1.82 W/m^2. At the same time, the AR5 lists CH4 as increasing from 722 ppb to 1,803.3 ppb, with an accompanied forcing increase of 0.48 W/m^2.

We already have the simple log constant for CO2. It is 5.35. The constant for CH4 is determined to be 0.524 by solving the math.

In Excel:

5.35 x ln(390.48/278) = 1.817692663

0.524 x ln(1803.3/722) = 0.479643

When calculated this way, CO2 is more than 10 times stronger than CH4. We can now calculate the sensitivity based on the formulas:

5.35 x ln(2) = 3.708337416

0.524 x ln(2) = 0.363209123

Neither of these formulas stay accurate, as CH4 changes are modulated by N2O changes. What the IPCC does not use is a similar formula based on H2O modulation. As H2O increases, the effects of CO2 will decrease, and vice-versa, though the IPCC only uses the simplified formula for CO2. It needs to be as complex as the ones for CH4 and N2O.

As heat increases the water vapor content of the atmosphere, the effects of CO2 are diminished. they work together and cannot properly be calculated apart.
 
Why does that matter regarding understanding of the material?

I have done nothing new. Only shown how the math relates. Can you follow what I did?
It matters because you might then realize what the difference is between an amateur with an ideology and a real professional.
 
It matters because you might then realize what the difference is between an amateur with an ideology and a real professional.
Why do you say such things? You have no right to criticize me on topics you are clueless about. If you want to attack me, do so with authority of knowledge. Not stupid cult-like indoctrinated remarks. Tells us all how I am wrong.

As is stands, you are acting like a low-life bully. Just attacking to attack.

Do you like being "that guy?"

I have always believed bullies have such low self-esteem, that they have to attack others to feel better.

Are you really that guy?
Calling established science a ‘cult’ is absurd.

And I have told you repeatedly how you are wrong, you just can’t accept it.

And when you ask yet again for me to look at your work and prove it wrong, I look at you like some nutty lady who shows me five reference papers and a homemade chart of pharmacokinetic data to ‘prove’ they need to get more Xanax this month than they usually do.

After a while, you just have to look at them with pity and eventually laugh directly in their faces. And they still don’t get the point.
 
Calling established science a ‘cult’ is absurd.
I did not say that. My post is using established IPCC data and methodology.

you are in error again.
And I have told you repeatedly how you are wrong, you just can’t accept it.
Just saying I am wrong does nothing. If you cannot enunciate how I am wrong, then I just laugh at you.
And when you ask yet again for me to look at your work and prove it wrong, I look at you like some nutty lady who shows me five reference papers and a homemade chart of pharmacokinetic data to ‘prove’ they need to get more Xanax this month than they usually do.
What are you talking about? Are you inn Toon Town?
After a while, you just have to look at them with pity and eventually laugh directly in their faces. And they still don’t get the point.
Typical bully attitude, just doing it to do it.
 
I did not say that. My post is using established IPCC data and methodology.

you are in error again.

Just saying I am wrong does nothing. If you cannot enunciate how I am wrong, then I just laugh at you.

What are you talking about? Are you inn Toon Town?

Typical bully attitude, just doing it to do it.
FYI. This is how you come across.

For your own self awareness.

IMG_9067.webp
 
Only to people like you who lack the knowledge to follow what I say. You appear to be projecting your own methods.
You don’t get it. I don’t HAVE methods.

Much like I don’t have methods to explain why an MRI can or can’t work to detect the a tumor, or dont have methods to explain why the vaccine schedule for infants is too much or that the drones in NJ are not aliens or Iranians.
 
You don’t get it. I don’t HAVE methods.
That mush is obvious.

You should stop criticizing people who you disagree with, especially when you don't know anything about what they say.
Much like I don’t have methods to explain why an MRI can or can’t work to detect the a tumor, or dont have methods to explain why the vaccine schedule for infants is too much or that the drones in NJ are not aliens or Iranians.
Again, since you are ignorant of such things, you should not make a stupid claim, or assume others do not know what they speak of.

You make yourself look not only like a jack-ass, but an idiot too.

I do know what I am talking about, so back off!
 
That mush is obvious.

You should stop criticizing people who you disagree with, especially when you don't know anything about what they say.
When people give me a detailed description of my astrological sign, complete with orbital calculations and an assurance that ‘they know the sciences well,especially astrology’, I’ll criticize them at will.

Again, since you are ignorant of such things, you should not make a stupid claim, or assume others do not know what they speak of.
Yet literally no one but cranks agree with you. I think my assumption that you do not know what you speak of is a pretty damned accurate description.

You make yourself look not only like a jack-ass, but an idiot too.
By telling you what actual experts think?

LOL
I do know what I am talking about, so back off!
Ya don’t.

But the sad part is that I actually think you’re delusional enough to believe that you do.
 
When people give me a detailed description of my astrological sign, complete with orbital calculations and an assurance that ‘they know the sciences well,especially astrology’, I’ll criticize them at will.
Wow.

You are that desperate, that you go to that stuff.

Pathetic.
Yet literally no one but cranks agree with you. I think my assumption that you do not know what you speak of is a pretty damned accurate description.
How would you know?

Do people actually buy your shit?

I can back up what I say, and I have. If you are incapable of verifying or showing how I am wrong, stop trolling me.
By telling you what actual experts think?
You do not know what they think of my post. They would agree with me, because what I did is correct.
But the sad part is that I actually think you’re delusional enough to believe that you do.
You are the delusional one who cannot tell us how I am wrong, but claim I am anyway.

Do you know how many people are laughing at you right now?
 
RE (Radiative Efficiency) and GWP (Global Warming Potential) explained. I consider both RE and GWP nonsensical metrics for studying the climate system regarding greenhouse gasses. This is because the values are a linearized value between two points on a log curve and grow in error very fast.

RE is seen in the tables as to its calculation. It is the forcing value difference with 1 ppb (part per billion) of gas added. This makes it a slope of the graph between the gas levels and forcing levels of the two points. Because this is a linear slope, it does not follow the log curve, and this makes it an unrealistic metric to use.

GWP is similar, except it uses a kilogram added to the starting gas level instead of a ppb. Since CH4 has a molar mass of 16, and CO2 a molar mass of 44, the metric is using 2.75 time CH4 as CO2 for comparisons.

Here is what the IPCC uses for the greenhouse formulas. It is found on page 358 of the TAR (Third Assessment Report) WG1 (Working Group 1). I circled the formulas from Table 6.2 that I used to make the graph. GWP formula and explanation is found on page 385 of the TAR.

The graph I presented matches the numbers for RE as found in Table 2.1 of the AR5 (5th Assessment report). Table 8.A.1 has N2O at a different RE, which really bugs me about the IPCC. They have errors found now and again. I included it because it shows the GWP numbers for the AR5.

View attachment 67547817

View attachment 67547819

Here is the graph that I made using the IPCC AR5 WG1 numbers, and formula found in the TAR WG1:

View attachment 67547818

Now look at the numbers also. My RE slopes are 1000 times greater than the RE values of the IPCC. That is because I graphed the X-Axis in ppm (parts per million) instead of ppb (parts per billion). They are otherwise the same. Small changes will matter little so I will show the connection between RE and GWP. We will start by using RE of CO2 and CH4. 3.63e-4 / 1.37e-5 = 26.5. Since GWP uses mass instead of volume, we multiply this by the mass ratio of the two molecules, or 2.75. 26.5 x 2.75 = 72.9. This is close to the GWP of 84 used by the IPCC for the 20 year horizon.

Note the scaling between the gasses on the graph. At equal levels, CO2 is much greater than CH4. Notice that the RE trend lines fall away from the actual gas curve very quickly. It is a lie to say the CH4 is the stronger greenhouse gas. It just has a greater forcing increase per the same amount of added gas.

Don’t let the scare tactic of using GWP affect you. It has no real meaning.

Any questions?

Suppose that all of this is true and without error. All of it.

Why not publish your findings?
 
Why does that matter regarding understanding of the material?

I have done nothing new. Only shown how the math relates. Can you follow what I did?

I, with my superior Google-fu, know more than all them so-called }experts" -- combined!!! Huh! Huh! Huh!

:rolleyes:
 
Suppose that all of this is true and without error. All of it.

Why not publish your findings?
Why should I? It is simple math. All I did was show what the IPCC material represents, using what they say and publish. Any algebra student can see what I did as correct.
 
I, with my superior Google-fu, know more than all them so-called }experts" -- combined!!! Huh! Huh! Huh!

:rolleyes:
I didn't know you claim that.

I most certainly don't make such claims. Anyone who was in my 7th grade algebra class could follow what I did.
 
Why should I? It is simple math. All I did was show what the IPCC material represents, using what they say and publish. Any algebra student can see what I did as correct.

Definite integrals and natural logs are taught in basic algebra class? Yeah OK.

Go publish your work if you want us to take you seriously.
 
Suppose that all of this is true and without error. All of it.

Why not publish your findings?

"Why not publish your findings"

In the world of what gets published and what doesn't get published;
Why doesn't the IPCC or anyone else for that matter publish how much
more global warming methane will produce given that it's increasing
about 7 ppb every year?

If anyone thinks it's any more than 0.1°Celsius by the end of the century,
they should pipe up with their source and or show their work.
 
Back
Top Bottom