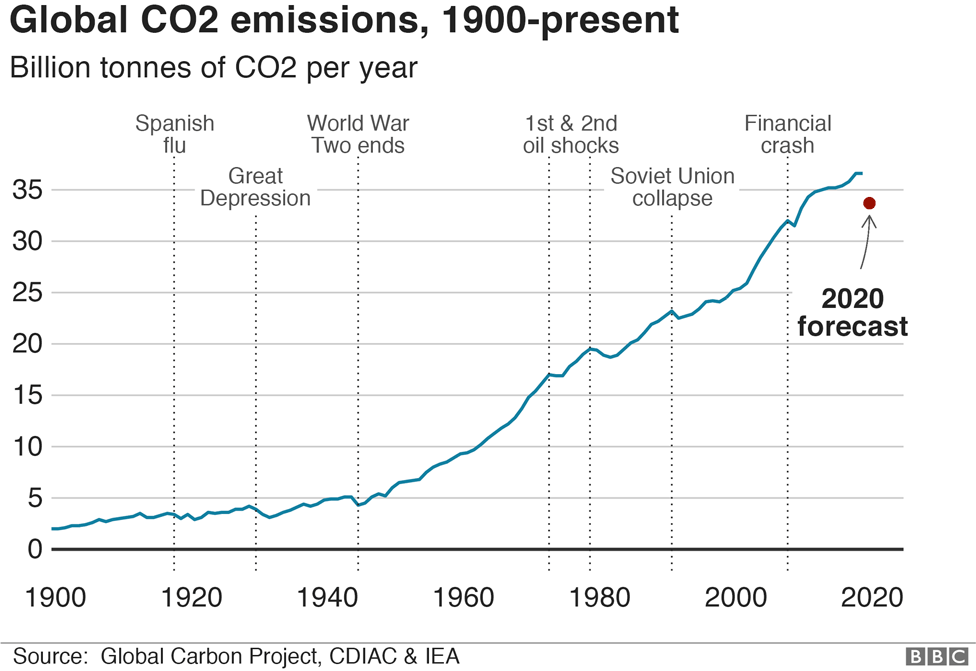
Pretty amazing what a little social distancing can achieve.
It will be interesting to see when the drop in emissions, is actually reflected in the CO2 levels.
Global Monitoring Laboratory - Carbon Cycle Greenhouse Gases
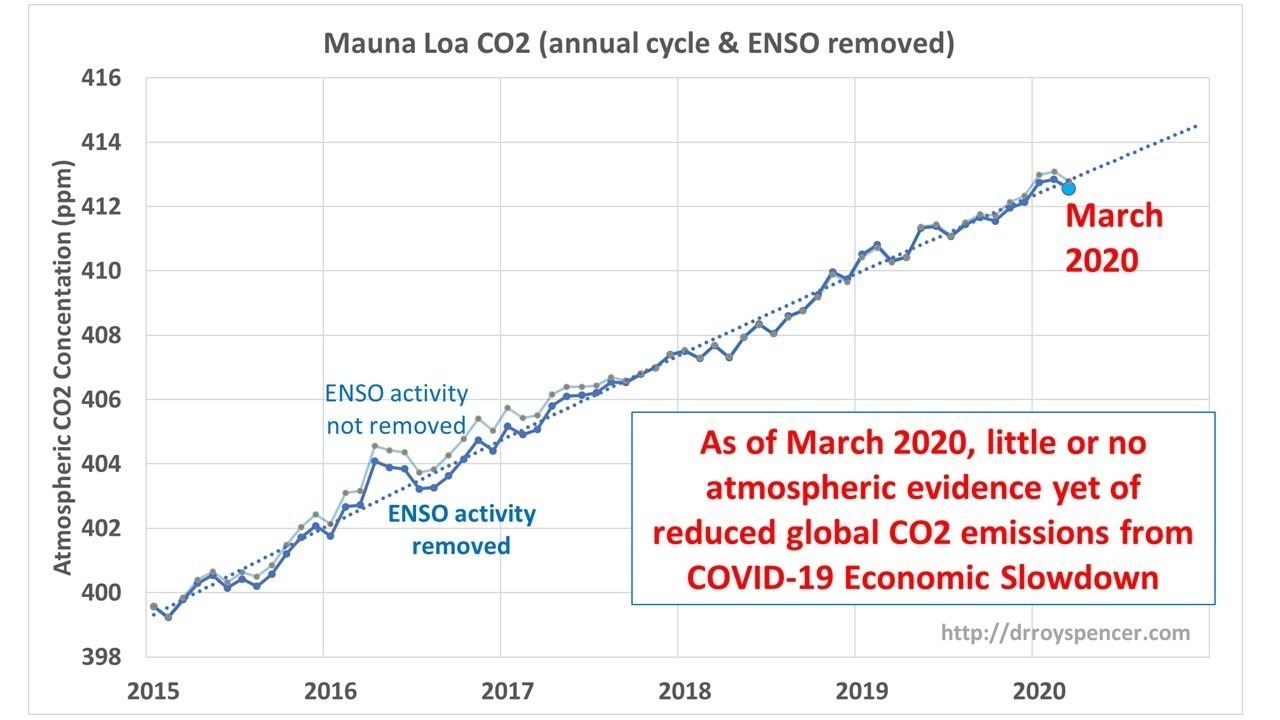
The trend looks like a normal year so far.
2018 12 2018.958 409.07 409.07 409.75 30
2019 1 2019.042 410.83 410.83 410.52 26
2019 2 2019.125 411.75 411.75 410.89 27
2019 3 2019.208 411.97 411.97 410.48 28
2019 4 2019.292 413.33 413.33 410.50 27
2019 5 2019.375 414.65 414.65 411.18 28
2019 6 2019.458 413.93 413.93 411.59 27
2019 7 2019.542 411.74 411.74 411.39 25
2019 8 2019.625 409.95 409.95 411.86 29
2019 9 2019.708 408.54 408.54 412.15 29
2019 10 2019.792 408.52 408.52 411.95 29
2019 11 2019.875 410.25 410.25 412.25 26
2019 12 2019.958 411.76 411.76 412.44 31
2020 1 2020.042 413.39 413.39 413.07 29
2020 2 2020.125 414.11 414.11 413.26 28
2020 3 2020.208 414.51 414.51 413.02 26
2020 4 2020.292 416.21 416.21 413.38 28
I know that we are in the increasing phase of the year,
but 4/2019 413.33 ppm
4/2020 416.21 ppm
a delta of a little less than 3 ppm, roughly the same for the last decade or two.