- Joined
- Oct 30, 2016
- Messages
- 31,842
- Reaction score
- 15,818
- Location
- Seattle Area
- Gender
- Male
- Political Leaning
- Independent
I'm happy to report I'm a Seattle area resident and I made it through the fire
I'm happy to report I'm a Seattle area resident and I made it through the fire
I laid out two links regarded as science. Are you going to deny science again?It’s like denial, shotgun style.
You bought one of those mini swamp coolers you see on the internet that are supposed to be able to cool better than AC? You should start a thread on that.I'm happy to report I'm a Seattle area resident and I made it through the fireAll I had was one of those minuature, personal swamp cooler thingees. My standing/portable air conditioner just arrived - I know - but there will be more heat waves this summer, it's only July 1!
Generally, a persistent pattern for 30 years.

No, no, no. I had one of those little personal swamp coolers. I just purchased a 14,000 btu standing, portable a/c unit.You bought one of those mini swamp coolers you see on the internet that are supposed to be able to cool better than AC? You should start a thread on that.
Yeah, you had one that you bought. Did you buy it thinking it would work better than AC because a commercial said so?No, no, no. I had one of those little personal swamp coolers. I just purchased a 14,000 btu standing, portable a/c unit.
No, dude. It's all I had because the a/c's were all backordered.Yeah, you had one that you bought. Did you buy it thinking it would work better than AC because a commercial said so?
Extreme heat events have always been a regular part of the summer season.
The right combinations of wind direction, lack of precipitation, and high pressure, can, and do create very hot conditions.
I did not single out Portland, as the heat wave affected the entire Pacific Northwest.
NOAA's Climate at a glance, shows the climate warming at 2F per century, so that would include all causes.
I think before this year the max June temp in Portland was 91F, so 115F is 24F above the earlier high,
of that perhaps 2F can be attributed to the climate warming, the rest is all weather!
Not at all! Consider our present location vs the potential fall in temperatures.
There is potentially a very steep drop in temperatures associated with getting CO2 much below 300 ppm.

Here are a few things to consider, before blaming greenhouse gasses for record temperatures in cities.
Reduced Natural Landscapes in Urban Areas. Trees, vegetation, and water bodies tend to cool the air by providing shade, transpiring water from plant leaves, and evaporating surface water, respectively. Hard, dry surfaces in urban areas – such as roofs, sidewalks, roads, buildings, and parking lots – provide less shade and moisture than natural landscapes and therefore contribute to higher temperatures.---Recent studies confirm and quantify that surface temperatures are higher in urban areas than in surrounding rural areas for a number of reasons, including the concentrated release of heat from buildings, vehicles, and industry. In the United States, this urban heat island effect results in daytime temperatures 0.9°–7.2°F (0.5°–4.0°C) higher and nighttime temperatures 1.8°– 4.5°F (1.0°–2.5°C) higher in urban areas, with larger temperature differences in humid regions (primarily in the eastern United States) and in cities with larger and denser populations. The urban heat island effect will strengthen in the future as the structure, spatial extent, and population density of urban areas change and grow (high confidence).
Climate Science Special Report: Changes in Land Cover and Terrestrial Biogeochemistry
This report is an authoritative assessment of the science of climate change, with a focus on the United States. It represents the first of two volumes of the Fourth National Climate Assessment, mandated by the Global Change Research Act of 1990.science2017.globalchange.gov
From the EPA:
Heat islands are urbanized areas that experience higher temperatures than outlying areas. Structures such as buildings, roads, and other infrastructure absorb and re-emit the sun’s heat more than natural landscapes such as forests and water bodies. Urban areas, where these structures are highly concentrated and greenery is limited, become “islands” of higher temperatures relative to outlying areas. Daytime temperatures in urban areas are about 1–7°F higher than temperatures in outlying areas and nighttime temperatures are about 2-5°F higher. Find more information on the Learn About Heat Islands page.
Heat Island Effect | US EPA
EPA's Heat Island Effect Site provides information on heat islands, their impacts, mitigation strategies, related research, a directory of heat island reduction initiatives in U.S. communities, and EPA's Heat Island Reduction Program.www.epa.gov
I laid out two links regarded as science. Are you going to deny science again?
Rural areas have a heat island effect too.The Northwest high was not only in urban areas.
I am curious, the humidity in the area looked low enough that the evaporative cooler might have done some good,I'm happy to report I'm a Seattle area resident and I made it through the fireAll I had was one of those minuature, personal swamp cooler thingees. My standing/portable air conditioner just arrived - I know - but there will be more heat waves this summer, it's only July 1!
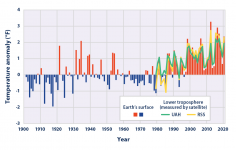
Yes, and what is the scale showing that average warming is, 2 degrees F since 1980,View attachment 67340784
This figure shows how annual average temperatures in the contiguous 48 states have changed since 1901. Surface data come from land-based weather stations. Satellite measurements cover the lower troposphere, which is the lowest level of the Earth’s atmosphere. “UAH” and “RSS” represent two different methods of analyzing the original satellite measurements. This graph uses the 1901–2000 average as a baseline for depicting change. Choosing a different baseline period would not change the shape of the data over time.
Data source: NOAA, 2021
Web update: April 2021

Climate Change Indicators: U.S. and Global Temperature | US EPA
This indicator describes trends in average surface temperature for the United States and the world.www.epa.gov
So thirty years makes it 1990? I see a trend, the trend is warming, and 30 years makes it long enough to be a statement about climate in America. Do you agree?
The graph is from the British Antarctic Survey.Fair warning. Next time you present a graph witnout a direct link to the source in direct contradiction to DP rules, and every time after that, I am going to report you. If you refuse to play by the rules, then you have no business's being here.
That's twice just today. That's enough.
It got me through the heat wave. It worked just fine.I am curious, the humidity in the area looked low enough that the evaporative cooler might have done some good,
Did it help much?
It looked like conditions were right for an evap cooler to do some good, but that is of course subjective to high high you are willing to raise theIt got me through the heat wave. It worked just fine.
Swamp Coolers work poor in high humidity areas and great in low humidity areas.It looked like conditions were right for an evap cooler to do some good, but that is of course subjective to high high you are willing to raise the
humidity to achieve cooling. Evaporative cooling would only work in Houston for the hottest portion of the day.
Correct, but during the peak heating hours of the recent heat wave the humidity was low.Swamp Coolers work poor in high humidity areas and great in low humidity areas.
In my miniature cooler you freeze the filter so that the vapor temp will always be below the outside air temp. Here's the amazon link to the item:It looked like conditions were right for an evap cooler to do some good, but that is of course subjective to high high you are willing to raise the
humidity to achieve cooling. Evaporative cooling would only work in Houston for the hottest portion of the day.
I'd be interested in seeing what it shows for the last 30 years. Can you run those figures? I think you'd agree that the impact of human activity on climate is dramatically different in 1990 to 2020 than it was from 1920 to 1990.Yes, and what is the scale showing that average warming is, 2 degrees F since 1980,
which is what I have been saying! A 24 F heat wave, if you excluded the global warming, would still be a 22F heat wave!
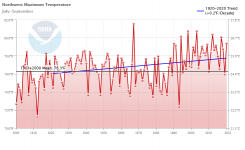
The summer maximum temperatures in the Pacific Northwest have been increasing at about .2F per decade, for the last century.
NOAA Climate at a glance Regional Time Series
View attachment 67340821
It didnt happen in my fairly rural neighborhood, but it happened right down the road and in many other areas: power outages.It looked like conditions were right for an evap cooler to do some good, but that is of course subjective to high high you are willing to raise the
humidity to achieve cooling. Evaporative cooling would only work in Houston for the hottest portion of the day.
It will be interesting what will be presented as concrete evidence of cause and effect?

View attachment 67340784
This figure shows how annual average temperatures in the contiguous 48 states have changed since 1901. Surface data come from land-based weather stations. Satellite measurements cover the lower troposphere, which is the lowest level of the Earth’s atmosphere. “UAH” and “RSS” represent two different methods of analyzing the original satellite measurements. This graph uses the 1901–2000 average as a baseline for depicting change. Choosing a different baseline period would not change the shape of the data over time.
Data source: NOAA, 2021
Web update: April 2021

Climate Change Indicators: U.S. and Global Temperature | US EPA
This indicator describes trends in average surface temperature for the United States and the world.www.epa.gov
So thirty years makes it 1990? I see a trend, the trend is warming, and 30 years makes it long enough to be a statement about climate in America. Do you agree?
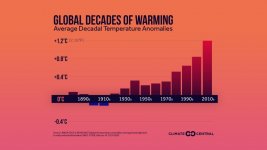

 www.climatecentral.org
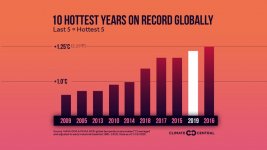
Feedback loops are an ongoing problem, I especially hate the idea of this loop.There this is also part of global there each decade is getting warmer and all the years since 2014 have been the warmest on record.
View attachment 67340914
View attachment 67340913

Top 10 Warmest Years on Record
The global numbers are in, and 2019 ranks as the 2nd hottest year on recordwww.climatecentral.org

