- Joined
- Jul 12, 2013
- Messages
- 1,185
- Reaction score
- 151
- Gender
- Male
- Political Leaning
- Very Liberal
Too old for more bull****...
Don't sell yourself short. Here's some USDA Prime Bull ...
"I would suggest Google. Median income has fallen since 2008..."

Too old for more bull****...
Don't sell yourself short. Here's some USDA Prime Bull ...
"I would suggest Google. Median income has fallen since 2008..."
Then reading comprehension is not your core competency. I said $75 K is not greatly above the median income (household) in the US.
A nearly 50% increase in one's income is not being "greatly above" that median level?
Unadjusted for inflation, it has. The Census Bureau website is your friend...
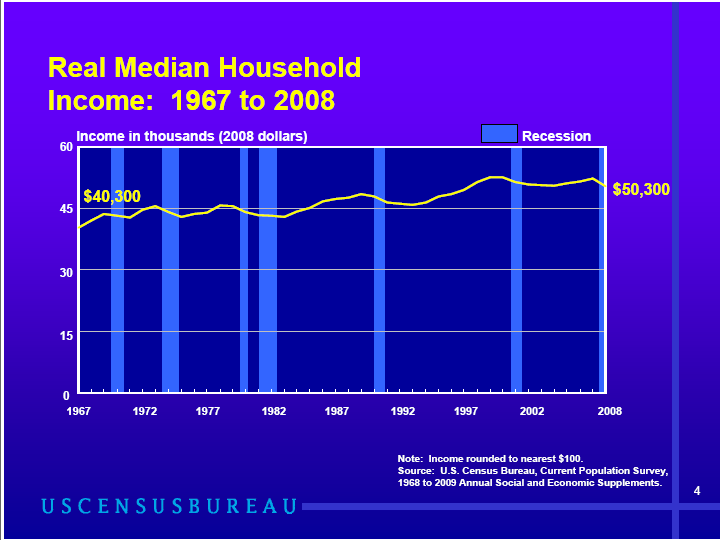
Median income is a number. Median income in real (inflation adjusted) is different, and is indeed falling, as it has since the early 80s.
Yes, it's a number upon which we are basing this discussion. Thank you for your agreement though, but I don't believe you could make the case that it has been in decline since the 80's...
Again, for the hard of reading, it is a single point, not a description of the CLASS.It's considered a quintessentially middle class income.
Median income is a number.
Again, for the hard of reading, it is a single point, not a description of the CLASS.
Wrong again:Median income is a number. Median income in real (inflation adjusted) Dollars (tied to a specific year) is different, and is indeed falling, as it has since the early 80s.
This is what I love about you, instead of accepting that the single point is not a description of the class....you instead decide to divert by describing the middle class.Correct. yadda yadda.
This is what I love about you, instead of accepting that the single point is not a description of the class....you instead decide to divert by describing the middle class.
You are not telling me anything I did not know. All you are doing is showing what a bore you are.
Wrong again:
The number is bigger. Inflation adjusted was added by you when backpedalling after being proved wrong. So if that's the discussion, it fell through most of Reagan, and rebounded in the last couple years of Reagan, and has fallen slowly, with exception of a nice rebound under Clinton's reign, as follows, inflation-adjusted and tied to 2011 Dollars, for males, and not households, albeit males are the larger driver of household incomes. If the BLS has household income, then I'll post it, historically and inflation adjusted ...
2011 32,986
2010 (37) 33,221
2009 (36) 33,747
2008 34,640
2007 36,009
2006 35,992
2005 36,031
2004 (35) 36,335
2003 36,602
2002 36,553
2001 36,969
2000 (30) 37,017
1999 (29) 36,841
1998 36,505
1997 35,226
1996 34,021
1995 (25) 33,062
1994 (24) 32,595
1993 (23) 32,343
1992 (22) 32,127
1991 32,964
1990 33,852
1989 34,839
1988 34,543
1987 (21) 33,685
1986 33,508
1985 (20) 32,514
1984 32,164
1983 (19) 31,401
1982 31,217
1981 31,969
1980 32,562
This is thru 2008, in 2008 Dollars. I've provided more current, post GR data, which is far more salient to problems of today. And of course, as you say, it's just a point. Hahahahahahaha. Ahhh.
I'm not sure of the source for your figures, but nominal median income in 1980 was ~$16.8
I am not "ignoring" it, that was not the point that I was making to "bama. The two of you can have your silly error filled argument about what the median of the middle class is, it has no real bearing on the causes of the "hollowing out".Also misquoting me and ignoring the fact that MEDIAN INCOME is the holy grail in measuring middle class growth / contraction is kinda cheesy, if not patently stupid.
BLS, spreadsheet (Table P-2. Race and Hispanic Origin of People by Median Income and Sex: 1947 to 2011, ALL RACES)
And we have a culprit: Obama, who pays lip-service to raising the FMW, but has done little else.
I am not "ignoring" it, that was not the point that I was making to "bama. The two of you can have your silly error filled argument about what the median of the middle class is, it has no real bearing on the causes of the "hollowing out".
And why you decided to start firing away at me is beyond me, you have done this twice without purpose, other than some lame attempt to show that you are wearing big boy pants.
Hint: pick your fights more carefully.
Well that is a stupid argument, do you think that showing the same data from 2012 in 2012 numbers is going to not show the same decline from 1999....rather than your "early 80's"?This is thru 2008, in 2008 Dollars. I've provided more current, post GR data, which is far more salient to problems of today. And of course, as you say, it's just a point. Hahahahahahaha. Ahhh.
Not to you bama, you keep skipping the point's made to you.Did you make a point? Damn, I missed it...
Not to you bama, you keep skipping the point's made to you.
I did not know your ignorance was my issue.Not making much of an impression, are you?
It was $75 K for an individual or $118 K for a household (families), in 2006. So families making probably $130 K, in 2013 Dollar, are at the very low end of the top 10%. A family making $75 K, today, is not too far above the median household income. Ergo, indeed very middle class.