- Joined
- Jan 28, 2013
- Messages
- 94,823
- Reaction score
- 28,342
- Location
- Williamsburg, Virginia
- Gender
- Male
- Political Leaning
- Independent


DROUGHTClimate Alarmists Invent New Fake Link to California Wildfires
The media are hyping a new study claiming climate change has doubled the number of high-risk wildfire days in California. The claim depends on the assertion that autumn precipitation in California has “dropped 30% since 1980.” In reality, autumn precipitation in California has been rising by 0.02 inches per decade. Oops, time to cancel another fake climate crisis.
Activist scientists representing The Nature Conservancy and government-funded institutions wrote up the study, which should immediately invoke skepticism. The Nature Conservancy is a climate activist organization that raises more than $1 billion each year, much of it based on climate alarmism. Accordingly, Nature Conservancy studies are likely to be biased toward alarmist climate conclusions and should be examined closely. . . .
[FONT=&]April 5, 2020[/FONT]
We so much need the no lying and calling it science law.
DROUGHTClimate Alarmists Invent New Fake Link to California Wildfires
The media are hyping a new study claiming climate change has doubled the number of high-risk wildfire days in California. The claim depends on the assertion that autumn precipitation in California has “dropped 30% since 1980.” In reality, autumn precipitation in California has been rising by 0.02 inches per decade. Oops, time to cancel another fake climate crisis.
Activist scientists representing The Nature Conservancy and government-funded institutions wrote up the study, which should immediately invoke skepticism. The Nature Conservancy is a climate activist organization that raises more than $1 billion each year, much of it based on climate alarmism. Accordingly, Nature Conservancy studies are likely to be biased toward alarmist climate conclusions and should be examined closely. . . .
April 5, 2020
once again real science shows facts.
this guy will never get through the peer review process.
his paper will be rejected because it does not comply with the IPCC doomsday machine.
Oh boy!! More stupidity from the Heartland Institute.
The author of this article is using the "Climate at a glance" data wrong. He claims that he is showing data for just 2 months but it is actually for the whole year. Just click on his links and note the time period is for 12 months.
So... his claim that there was a very wet autumn in 2019 is just completely wrong.
And while he complains that the original study is cherry-picking the last 40 years of precipitation data he then goes on to cherry-pick a 30 year time period. What a hypocrite.
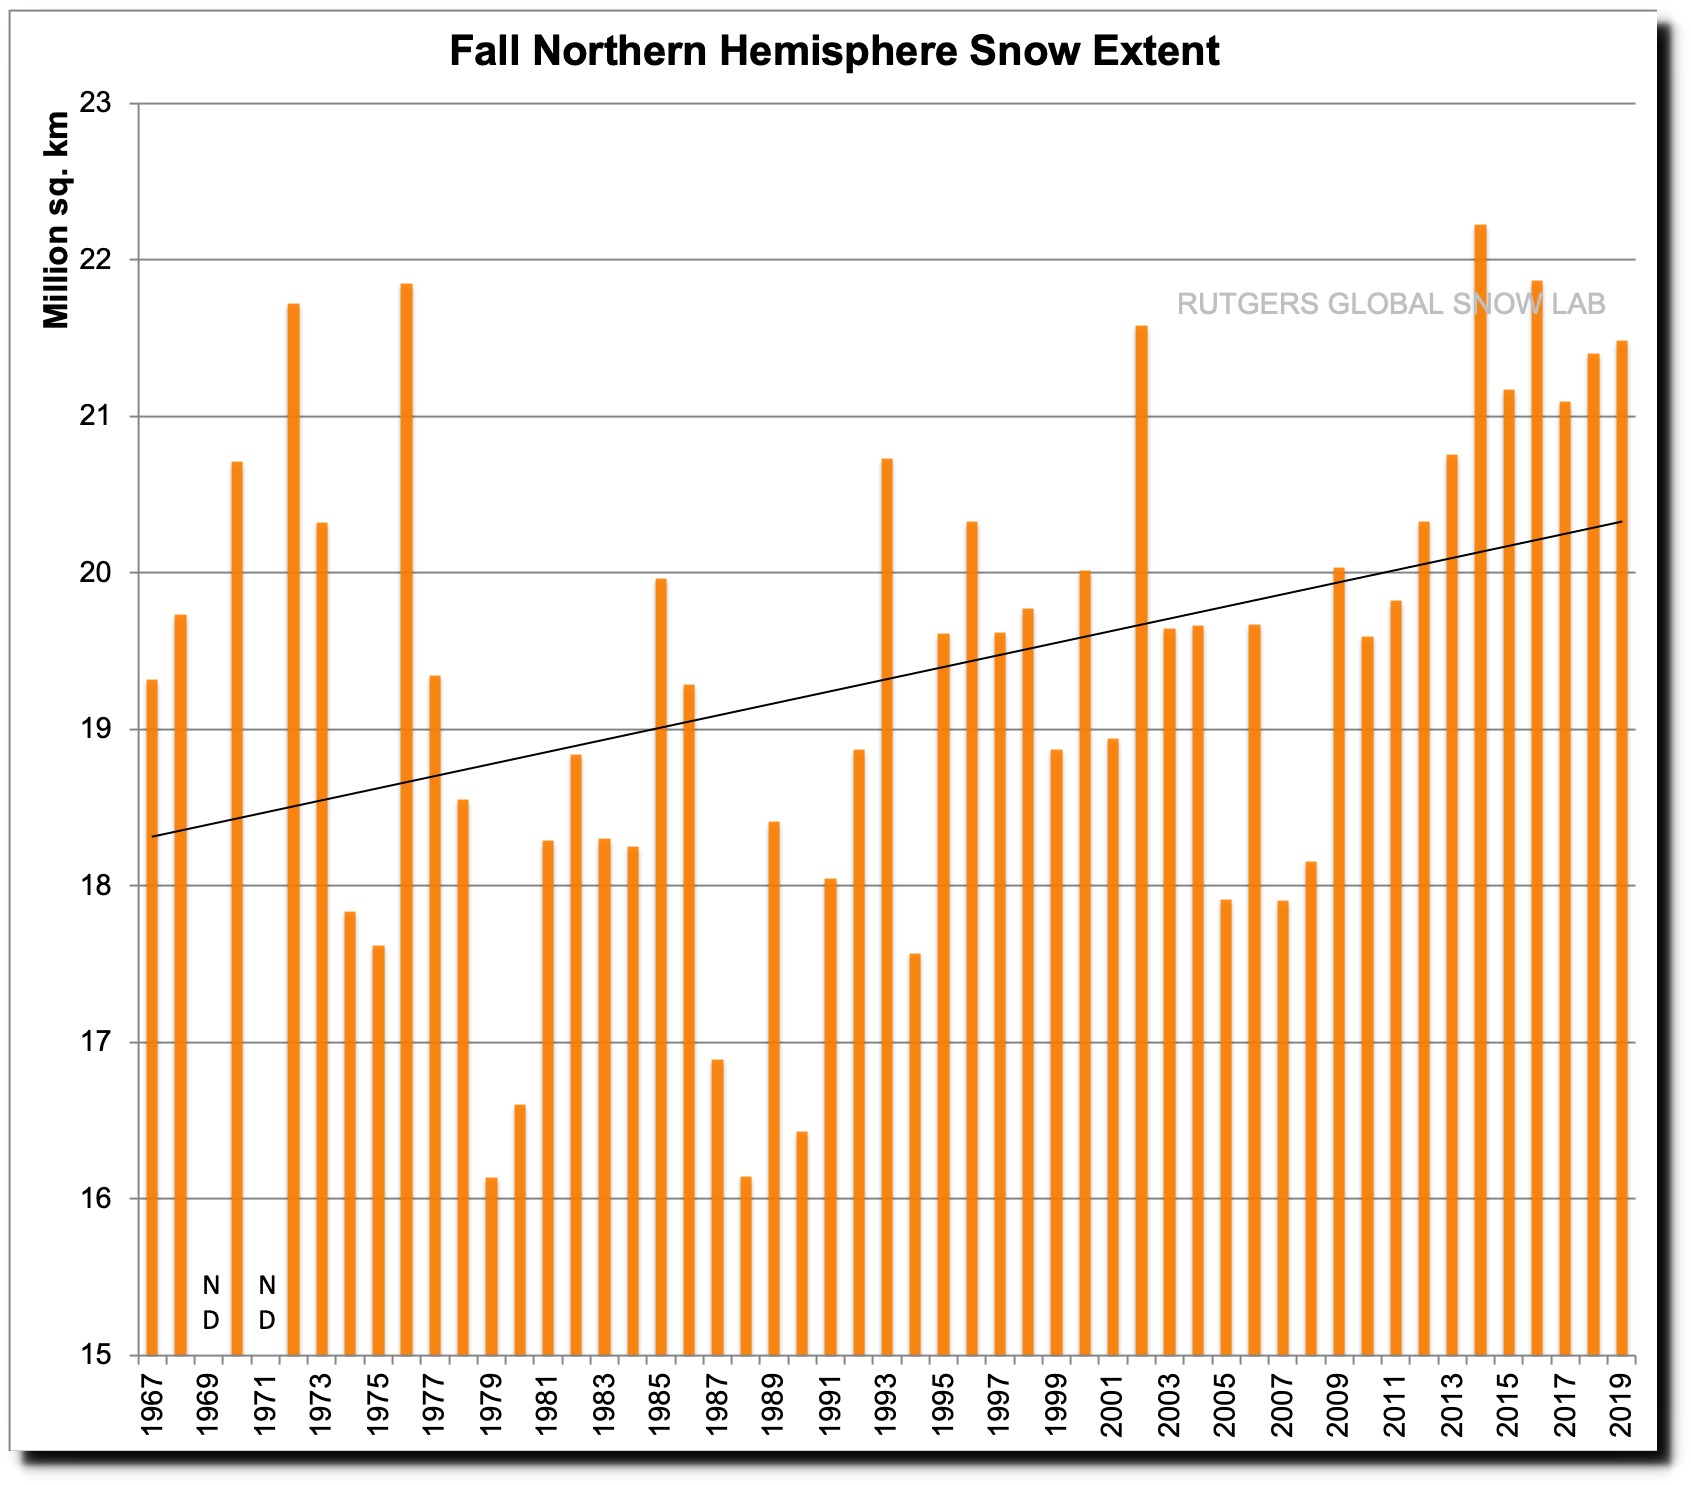
I also find it funny that he only talks about precipitation and ignores completely the rapidly increasing trends in fall temperatures, fire weather index, and the amount of burned areas.
The author of this article is an idiot and denialist.
Bandwagon Of Doom Washed Away By Tidal Wave Of Data - The Global Warming Policy Forum (GWPF)
Before the Alarmists say it, yes, it has yet to be peer reviwed.
But since we are all bored..
And given that we all know this is obvious already...
Why don't you vet your sources.? You choose the web site of a lobbiest group , funding unknown, and that group is highly biased, and unscientific. Global Warming Policy Foundation - Wikipedia
It's a superb site of great value.
I am sure think so. You , after all, are a devotee of 'watssupwithat'.
Did you read his paper, it very interesting and it does make sense. It goes against the IPCC's claim, so the IPCC will make sure this paper goes nowhere, so they can keep pumping out their propaganda.
Your prejudice is your prison.
The alarmist claim is about precipitation, so the rebuttal is about precipitation. The article is quite sound, and you are again in denial.
once again real science shows facts.
this guy will never get through the peer review process.
his paper will be rejected because it does not comply with the IPCC doomsday machine.
You are wrong... as usual.
The study being discussed is about wildfires in California and the factors involved and being assessed are more than just precipitation. This study also takes into account temperature trends, the fire weather index, and the amount of area burned.
Tell me Jack... why does the Heartland Institute ignore these other factors? And can you even bring yourself to fact check their use of the "climate at a glance" data? Or are you so stubborn that you won't even look at it?
Just more denial.
Jack Hays said:The claim of a precipitation drop is a lie.
I am not denying anything. Please don't lie.
It is not a lie. It is one interpretation of the data. And while sometimes an interpretation like this can be called into question or even legitimately refuted it is not automatically a lie.
To be completely honest the Heartland Institute author has a legitimate point to make about the precipitation numbers. But it is not the proof of refutation that he makes it out to be. As a matter of fact, it is generally accepted that a 40-year trend is better than a 30-year trend. But to be clear, because of a changing world, a 125-year trend is almost pointless.
Where the HI author gets this really wrong is in his incorrect use of the "climate at a glance" data and his decision to ignore all the other data that show how fires in California are likely to increase. You are also ignoring these facts.
Besides Jack, if using a 40-year precipitation trend over a 30-year trend to get the result wanted is a lie then isn't it a lie when you and your fellow denialists use very short trends in temperature to claim the planet is cooling also a lie? Like your often used trends of 2 or 3 years or even a single month of UHI data. If this study's use of a 40-year trend over a 30-year trend is a lie then your constant use of ridiculously short trends of UHI temperatures to push global cooling is also a lie. This also goes for numerous other sources of data that you denialists love to use to misinform people. Like your frequent use of very short trends in sea ice.
Sorry, Jack... if you are going to claim this study in question is lying then by the same standard you frequently lie.
Denial. Dismissed.
Oh boy!! More stupidity from the Heartland Institute.
The author of this article is using the "Climate at a glance" data wrong. He claims that he is showing data for just 2 months but it is actually for the whole year. Just click on his links and note the time period is for 12 months.
So... his claim that there was a very wet autumn in 2019 is just completely wrong.
And while he complains that the original study is cherry-picking the last 40 years of precipitation data he then goes on to cherry-pick a 30 year time period. What a hypocrite.
I also find it funny that he only talks about precipitation and ignores completely the rapidly increasing trends in fall temperatures, fire weather index, and the amount of burned areas.
The author of this article is an idiot and denialist.
The author of this article is using the "Climate at a glance" data wrong. He claims that he is showing data for just 2 months but it is actually for the whole year. Just click on his links and note the time period is for 12 months.
Why don't you vet your sources.? You choose the web site of a lobbiest group , funding unknown, and that group is highly biased, and unscientific. Global Warming Policy Foundation - Wikipedia
Why don't you deal with the ideas rather than attacking the source of the ideas?
Why do you blindly follow the propaganda?
Why are yuou incapable of thinking for yourself?
Why do you avoid doing anything that would look like thinking for your self?
Well, I go through a specific process. The first part of any process is ..does the source have an ulterior motive or is it a reliable source. Then,if it is a reliable source, then I go down the rabbit hole to examine the claims. If the source has strong ulterior motives and is unreliable, then that tells me that the information is more likely than not to be corrupted. It's known as 'vetting sources'. Using this source about climate change is like using any of Ken Hams sites about science.
If someone is unable to even vet a source properly, it's hard to accept anything they say.