- Joined
- Jun 14, 2019
- Messages
- 1,333
- Reaction score
- 732
- Gender
- Female
- Political Leaning
- Very Liberal
A lot of news coverage has been given to the fact that in 2021 the net worth of billionaires shot up dramatically. What's been given less attention is that the net worth of poor and middle class Americans shot up even faster. Thanks to surging home values, higher stock values, and COVID rescue payments (which poorer people used to pay down massive amounts of debt), Americans saw an increase in net worth unlike anything since the Fed started tracking, and quite probably ever.
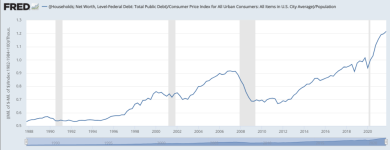
Anyway, I thought of an interesting way to visualize the change over time. Basically, take total household net worth and subtract the federal debt (so you have the net worth we'd be left with if we paid off the debt). Then divide by inflation (so that you're measuring real growth, rather than just inflated prices). Finally, divide by population (so that you're measuring per-capita growth, not just population growth). Here's what the result looks like:

You can really see, there, how much of net worth is driven just by property values. For example, after the Q1 2007 peak, we had the housing collapse, with net worths falling dramatically and taking years to return to sustained growth.
Anyway, I thought of an interesting way to visualize the change over time. Basically, take total household net worth and subtract the federal debt (so you have the net worth we'd be left with if we paid off the debt). Then divide by inflation (so that you're measuring real growth, rather than just inflated prices). Finally, divide by population (so that you're measuring per-capita growth, not just population growth). Here's what the result looks like:

You can really see, there, how much of net worth is driven just by property values. For example, after the Q1 2007 peak, we had the housing collapse, with net worths falling dramatically and taking years to return to sustained growth.


