• This is a political forum that is non-biased/non-partisan and treats every person's position on topics equally. This debate forum is not aligned to any political party. In today's politics, many ideas are split between and even within all the political parties. Often we find ourselves agreeing on one platform but some topics break our mold. We are here to discuss them in a civil political debate. If this is your first visit to our political forums, be sure to check out the RULES. Registering for debate politics is necessary before posting. Register today to participate - it's free!

Scare stories continue

longview

DP Veteran
Joined
Jan 25, 2012
Messages
44,608
Reaction score
14,469
Location
Texas
Gender
Male
Political Leaning
Conservative
I saw this story just now, and thought the California coast has not seen much sea level rise at all,
and the say they are expecting up to 6 feet of sea level rise by 2100.
Crumbling sea cliffs and coastal flooding: What rising sea levels mean for SLO County
Oceans are rising globally because of melting ice caps and expanding seas as the planet’s atmosphere warms from human-caused climate change. Scientists predict seas could rise in San Luis Obispo County anywhere from half a foot to more than a foot by 2050, or up to 6.27 feet by 2100.
This contrasts sharply with the observed data.
NOAA Relative Sea Level Trend 9412110 Port San Luis, California

The relative sea level trend is 0.96 millimeters/year with a 95% confidence
interval of +/- 0.34 mm/yr based on monthly mean sea level data from
1945 to 2022 which is equivalent to a change of 0.31 feet in 100 years.

It is even worse, as the sea levels appear to have been falling for the past 7 years.

1685537421096.png


I saw this story just now, and thought the California coast has not seen much sea level rise at all,
and the say they are expecting up to 6 feet of sea level rise by 2100.
Crumbling sea cliffs and coastal flooding: What rising sea levels mean for SLO County

This contrasts sharply with the observed data.
NOAA Relative Sea Level Trend 9412110 Port San Luis, California

It is even worse, as the sea levels appear to have been falling for the past 7 years.

View attachment 67450472


A quick check on the Port San Luis station at the Permanent Service for Mean Sea Level and
Excel's 2nd order Polynomial show equation function says the the acceleration at the Port San
Luis station is 0.0106 mm/yr² since 1946. So if someone wants to claim 0.084 mm/yr² claimed
by the satellites, it's not true.
Satellites are incapable of measuring the sea level at one particular location,
and even then only to about one inch less the difference between the astronomical tide, and the actual tide.
 
I saw this story just now, and thought the California coast has not seen much sea level rise at all,
and the say they are expecting up to 6 feet of sea level rise by 2100.
Crumbling sea cliffs and coastal flooding: What rising sea levels mean for SLO County

This contrasts sharply with the observed data.
NOAA Relative Sea Level Trend 9412110 Port San Luis, California

It is even worse, as the sea levels appear to have been falling for the past 7 years.

View attachment 67450472


It's a scam sea levels aren't rising very fast so the ultra wealthy that peach about it but Hines and get them insured on the coast.

No banks would invest at all in coastal development if they believed sea levels were going to rise that dangerously.
 
I saw this story just now, and thought the California coast has not seen much sea level rise at all,
and the say they are expecting up to 6 feet of sea level rise by 2100.
Crumbling sea cliffs and coastal flooding: What rising sea levels mean for SLO County

This contrasts sharply with the observed data.
NOAA Relative Sea Level Trend 9412110 Port San Luis, California

It is even worse, as the sea levels appear to have been falling for the past 7 years.

View attachment 67450472


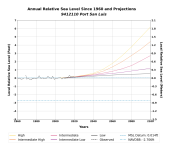
And here are NOAA's projections from the same website:
Screenshot 2023-05-31 at 23-05-41 Sea Level Trends - NOAA Tides & Currents.png

So, who to believe... a known climate change denialist or NOAA. I'll stick with NOAA.
 
The sky is falling. Right?
 
A quick check on the Port San Luis station at the Permanent Service for Mean Sea Level and
Excel's 2nd order Polynomial show equation function says the the acceleration at the Port San
Luis station is 0.0106 mm/yr² since 1946. So if someone wants to claim 0.084 mm/yr² claimed
by the satellites, it's not true.
The sea level I believe is rising more than the gauges see. Im pretty sure that the land is rising on most of the west coast and sinking on most of the east coast. Normal tectonic activity.
 
Satellites are incapable of measuring the sea level at one particular location,
and even then only to about one inch less the difference between the astronomical tide, and the actual tide.
There are also too many calibration issues and modulation from the atmosphere to assume accuracy that high from satellites.
 
And here are NOAA's projections from the same website:
View attachment 67450574

So, who to believe... a known climate change denialist or NOAA. I'll stick with NOAA.
Did you follow up and read what scenarios they were using?
Section 2: Future Mean Sea Level: Scenarios and Observation-Based Assessments
In Sweet et al. (2017), these scenarios were developed to span a range of 21st-century GMSL rise from 0.3 m to 2.5 m.
Sweet et al. (2017) built these scenarios upon the probabilistic emissions scenario–driven projections of
Kopp et al. (2014). Kopp et al. (2014) combined a variety of different lines of evidence—global climate model
(GCM) projections, the IPCC AR5 assessment of ice-sheet changes, and structured expert-judgment ice-
sheet projections, among other sources of information—to generate distributions of future global and asso-
ciated regional sea level changes consistent with low, medium, and high emissions scenarios.
Consider that the rate of sea level rise since 1945 (78 years) has been 0.96 millimeters/year,
which if that rate continues for the next 77 years would raise the sea level by 74 mm, or 0.074 meters.
Since they have detected a slight acceleration, projected out that acceleration would create a rise of about 1 foot by 2100.
To hit a six foot sea level rise in the next 77 years would require a massive acceleration of the rate.
 
The climate cult has to scare the idiots, because otherwise nobody would listen to them.
 
Back
Top Bottom