• This is a political forum that is non-biased/non-partisan and treats every person's position on topics equally. This debate forum is not aligned to any political party. In today's politics, many ideas are split between and even within all the political parties. Often we find ourselves agreeing on one platform but some topics break our mold. We are here to discuss them in a civil political debate. If this is your first visit to our political forums, be sure to check out the RULES. Registering for debate politics is necessary before posting. Register today to participate - it's free!

Perspectives on Temperature

How The US Temperature Record Is Being Altered (Part 2)
Posted on October 20, 2020 by tonyheller
NOAA and NASA US temperature graphs have been massively altered over the past 20 years, to turn a 90 year cooling trend into a warming trend.
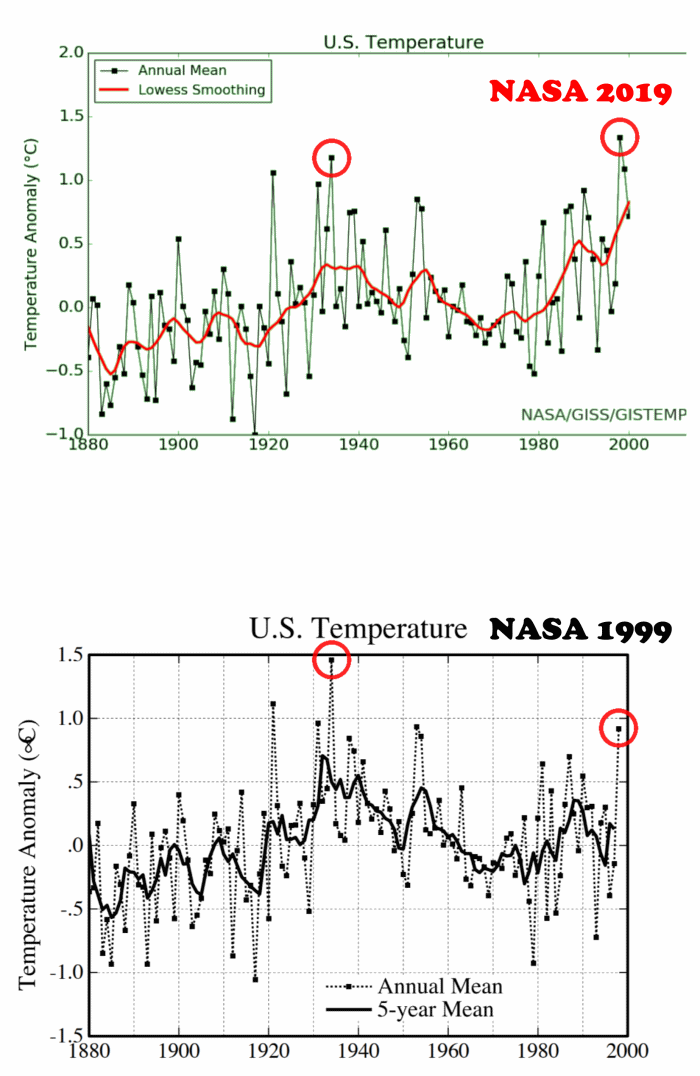
NASA-US-1999-2019-1.gif

NASA 1999 NASA 2019
The adjustments are being made by cooling the past nearly 1.5F and warming the present more than 0.5F. . . . .
 
New Study Finds A Robust Link Between European Temperatures And Solar Activity Via AMO/NAO Modulation
By Kenneth Richard on 22. October 2020

Share this...
Share on FacebookTweet about this on Twitter
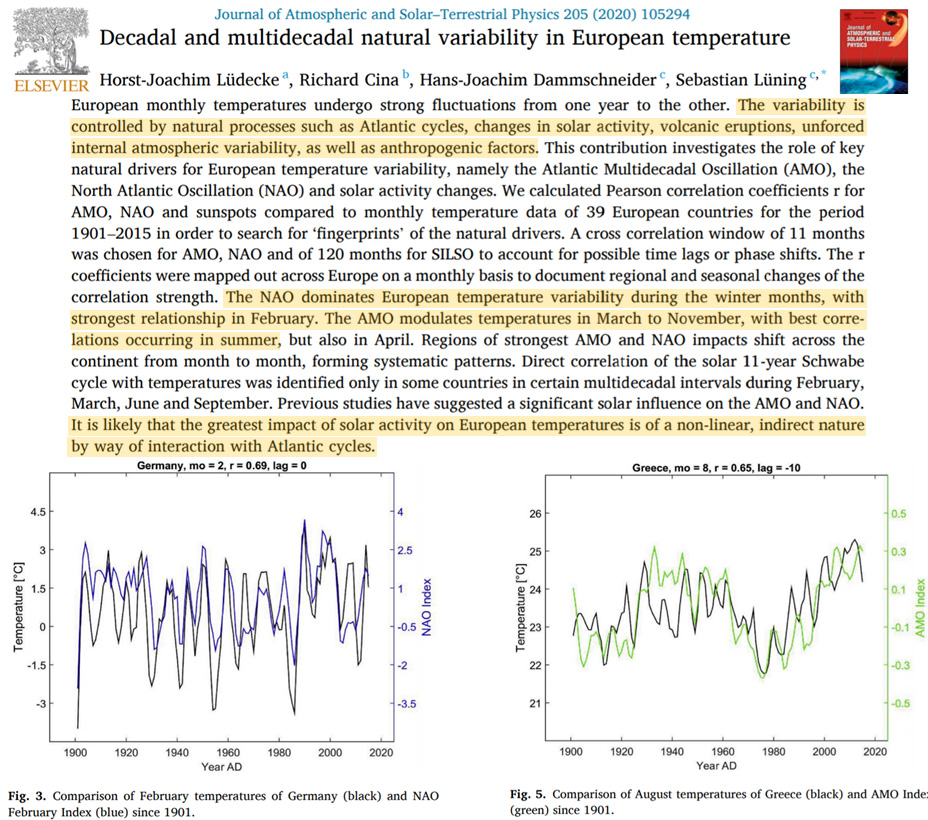
European winter temperature variability is “dominated” by the North Atlantic Oscillation (NAO), which is, in turn, modulated by solar activity.
Even proponents of anthropogenic global warming (AGW) agree natural processes (AMO, NAO, ENSO, solar forcing, volcanism) drive temperature variability. But they insist the rising temperature trend is human-caused.
So if we don’t have a regional upward trend, is the non-warming natural or anthropogenic?
Lüdecke et al., 2020 find temperatures across Europe have been oscillating, not rising in linear fashion, for the last century. The timings of the temperature undulations correspond quite closely to natural ocean cycles (the NAO and AMO). The authors detail a non-linear and indirect solar activity impact on these ocean cycles, and ultimately to the European climate.
NAO-AMO-and-solar-activity-drive-European-temp-variability-Ludecke-2020.jpg

Image Source: Lüdecke et al., 2020
 
Great Britain September Mean Temperatures Cooling. Also: Models Suggest Harsh, Long Winter Ahead
By P Gosselin on 24. October 2020

Share this...
Share on FacebookTweet about this on Twitter
By Kirye
and Pierre Gosselin
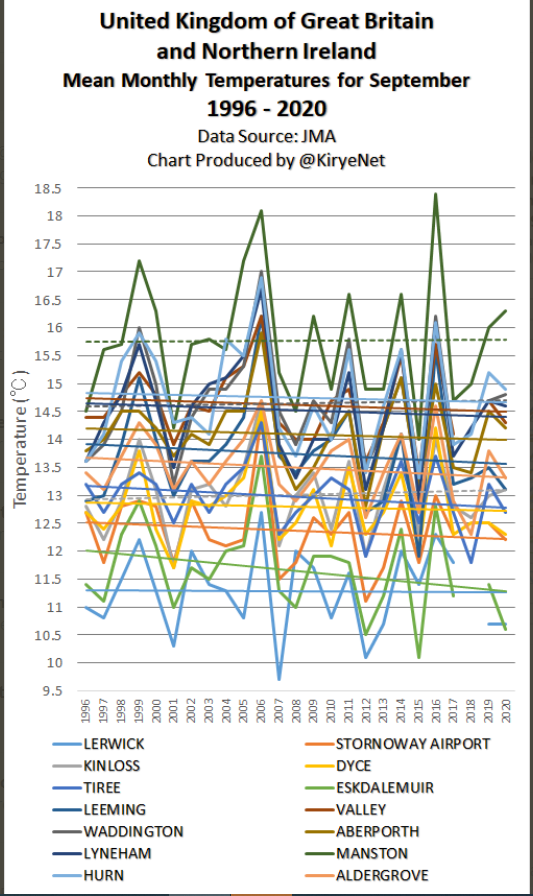
Compiled data show Great Britain early fall has been cooling over the past quarter century and models showing a harsh Europe 2020/21 winter in the works.
Compiling September data for Great Britain recorded by 14 stations for which the Japan meteorological Agency (JMA) has sufficient data, we plot the trends as follows:

Data: JMA
All 14 stations show September mean temperatures have been cooling or no trend for 25 years. This suggests that fall is approaching earlier instead of later, thus co0ntradicting alarmist claims of warming.

The cause of the cooling cannot be linked to CO2 and is likely driven by natural factors, such as oceanic cycles (Atlantic Multidecadal Oscillation) and solar activity. . . .
https://notrickszone.com/wp-content/uploads/2020/10/AMO_NCAR-UCAR.png
 
Bureau Of Meteorology: Central, Eastern Tropical Pacific “Coolest Since La Niña Event Since 2012”
By P Gosselin on 31. October 2020

Share this...
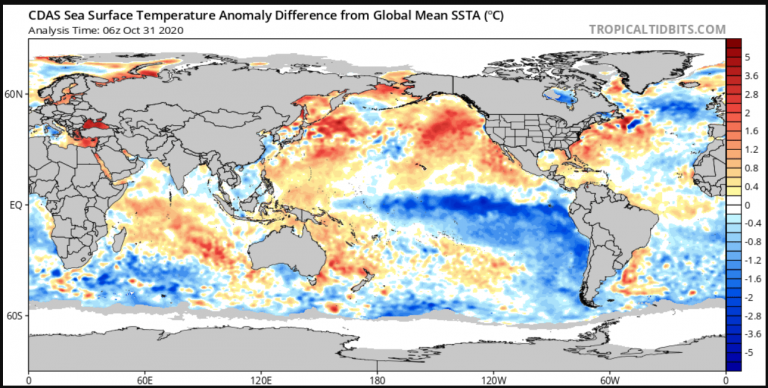
Data recorded from the equatorial Pacific show a substantial La Nina in place and falling temperatures with it.
The Australian Bureau of Meteorology (BOM) here reported on October 27: “All of the international climate models surveyed by the Bureau indicate the current La Niña will persist until at least January 2021. Most climate models reach their peak in December, before starting to weaken.”

Strong sea surface cooling developing in the equatorial Pacific. Image Tropical Tidbits
“Some models indicate that the current La Niña could possibly reach similar strength to the La Niña of 2010–12,” reports the BOM. “Sea surface temperatures in the central and eastern tropical Pacific are the coolest since the end of the La Niña event in 2012, but they are not as cool as during October 2010.”
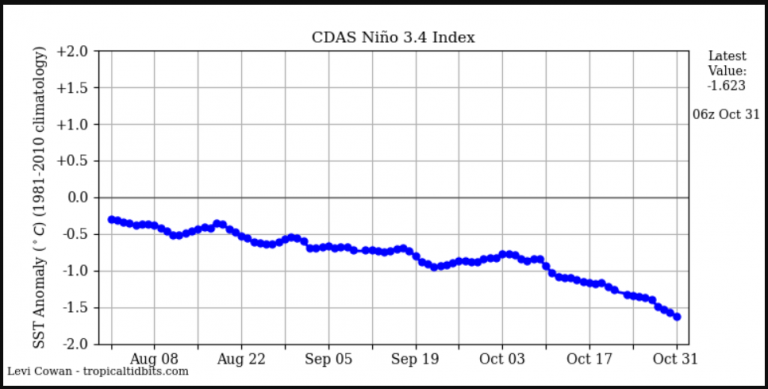
The following chart shows the latest sea surface temperature anomaly for the Pacific El Niño equatorial regions of 3 and 4:

Image: Tropical Tidbits

The substantial La Niña event will likely cause the global mean temperature to drop a few tenths of a degree Celsius.
Low solar activity
Another factor that could spell trouble, especially for Europe, is the currently very low solar activity. Harsh European winters have been found to be linked to low solar activity.
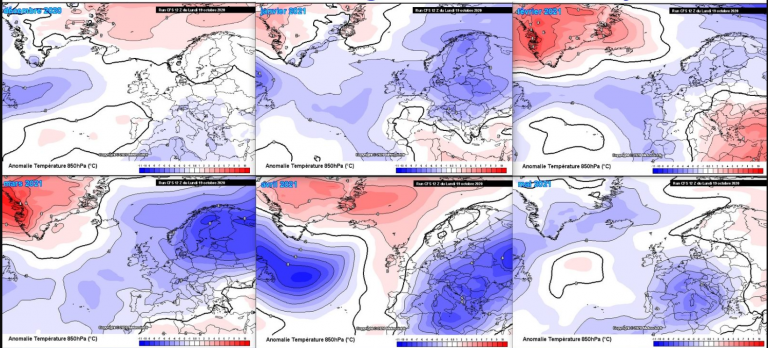
Indeed, as in previous calculations, the experimental numerical NOAA model CFSv2 recently predicted a cold and long winter in large parts of Europe, especially from January 2021 until May 2021, see the following chart:

Source: Meteociel CFSv2 forecasts winter 2020/21 Europe
 
Kingman, Kansas Has Had An Obvious Cooling Trend Since 1908!
Posted on October 31, 2020 by Kirye

Hi, everyone.
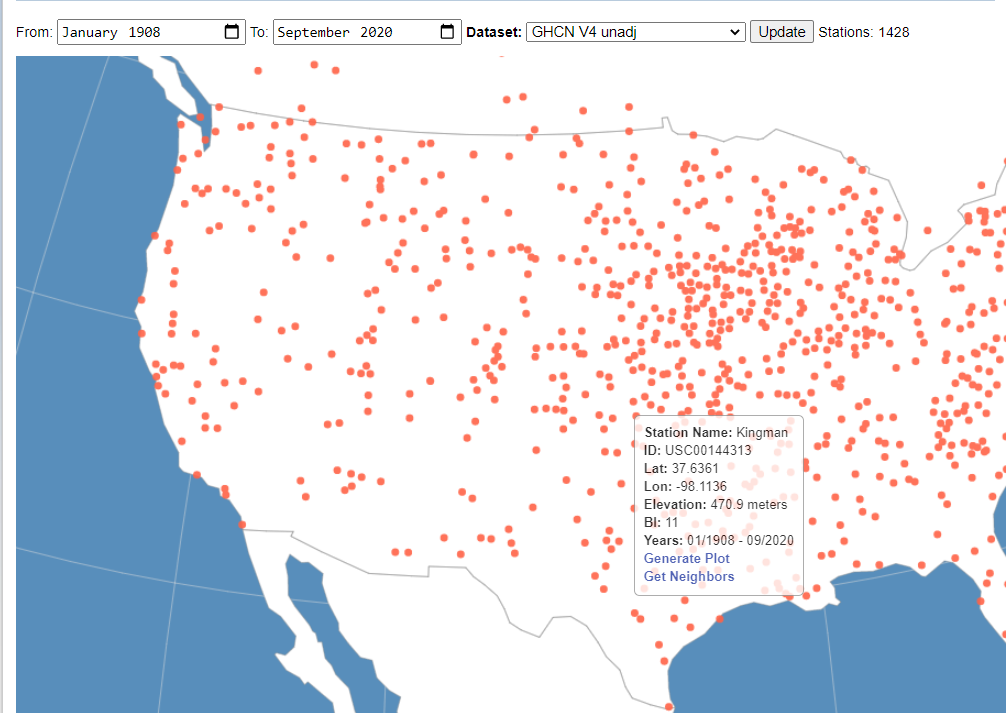
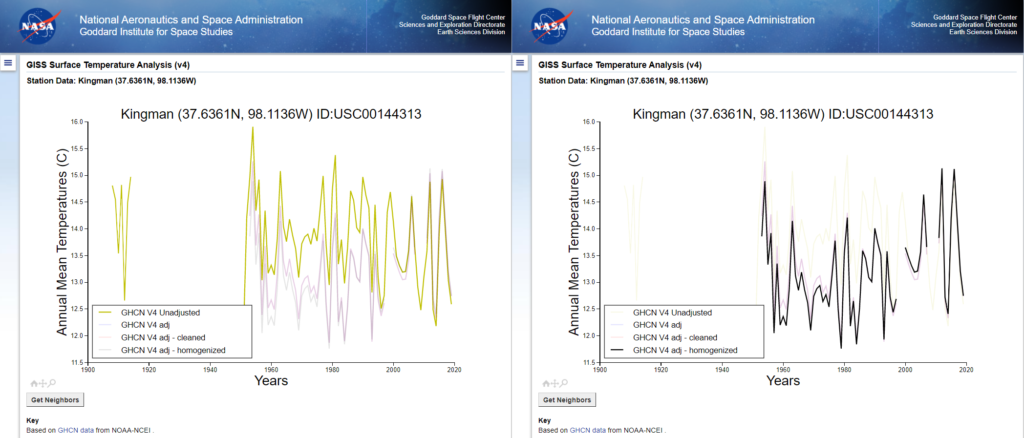
Today, I researched the mean annual temperatures in Kingman, Kansas.
The GHCN V4 Unadjusted data from NASA website show an obvious cooling trend since 1908.
However, the GHCN V4 adj – homogenized data show that the Kingman station doesn’t have any annual temperature data from 1908 to 1952, and the station has had a warming trend.

Why do NASA do such ridiculous things?

As is well known to many people, NASA likes changing their temperature data.
 
  • Like
Reactions: PoS
And the earth will continue it's cyclical rise in heat, until it's time to start cycling down to the next ice age.

Nothing to see here folks. All natural and normal.
Yeah AGW is out of control

Good thing we are trying to address it
 
Yeah AGW is out of control

Good thing we are trying to address it
No my scared friend. It's now out of control. It's subtle, and non-threatening.

I know we just had a blue-moon halloween, but that's no nee to be scared.
 
  • Like
Reactions: PoS
No my scared friend. It's now out of control. It's subtle, and non-threatening.

I know we just had a blue-moon halloween, but that's no nee to be scared.
The scientific community disagrees with you
 
Past peak.

UAH Global Temperature Update for October 2020: +0.54 deg. C
November 2nd, 2020
The Version 6.0 global average lower tropospheric temperature (LT) anomaly for October, 2020 was +0.54 deg. C, down slightly from the September, 2020 value of +0.57 deg. C.
The linear warming trend since January, 1979 remains at +0.14 C/decade (+0.12 C/decade over the global-averaged oceans, and +0.18 C/decade over global-averaged land).
For comparison, the CDAS global surface temperature anomaly for the last 30 days at Weatherbell.com was +0.33 deg. C.
With La Nina in the Pacific now officially started, it will take several months for that surface cooling to be fully realized in the tropospheric temperatures. Typically, La Nina minimum temperatures (and El Nino maximum temperatures) show up around February, March, or April. . . .
 
As Andrew Dessler, a professor of atmospheric sciences at Texas A. & M. University, recently put it, “If you don’t like all of the climate disasters happening in 2020, I have some bad news for you about the rest of your life.” Billions of people will have to dramatically change the way they live or the world will change dramatically or some combination of the two. My experience reporting on climate change, which now spans almost twenty years, has convinced me that the most extreme outcomes are, unfortunately, among the most likely
 
As Andrew Dessler, a professor of atmospheric sciences at Texas A. & M. University, recently put it, “If you don’t like all of the climate disasters happening in 2020, I have some bad news for you about the rest of your life.” Billions of people will have to dramatically change the way they live or the world will change dramatically or some combination of the two. My experience reporting on climate change, which now spans almost twenty years, has convinced me that the most extreme outcomes are, unfortunately, among the most likely
Why Dessler et al.’s critique of energy-budget climate sensitivity estimation is mistaken
Posted on April 30, 2018 by niclewis | 509 comments
By Nic Lewis Plain language summary A new paper by Andrew Dessler et al. claims, based on 100 simulations of the historical period (1850 to date) by the MPI‑ESM1.1 climate model, that estimates of climate sensitivity using the energy-budget method … Continue reading →
 
Yup. Orthodox climateers challenge Lewis at their own risk. He clearly bested Dessler in the linked debate over Lewis & Curry 2018. For another episode, you should review his takedown of Resplandy et al 2018, the retraction of which he single-handedly brought about.
 
Yup. Orthodox climateers challenge Lewis at their own risk. He clearly bested Dessler in the linked debate over Lewis & Curry 2018. For another episode, you should review his takedown of Resplandy et al 2018, the retraction of which he single-handedly brought about.
This is the guy that worked in finance his entire career and took up clinate change denial in retirement.

You guys cant even get scientists anymore. Lol
 
The drop will be steep.

Cooling Planet: NASA Projects Deep La Niña Event, Peak Temperature Deviation Up To -3°C!
By P Gosselin on 14. November 2020

Share this...
Share on FacebookTweet about this on Twitter
Data from NASA point to a powerful Pacific La Nina event in the works, and so with it could bring a considerable drop in the mean global surface temperature in 2021.
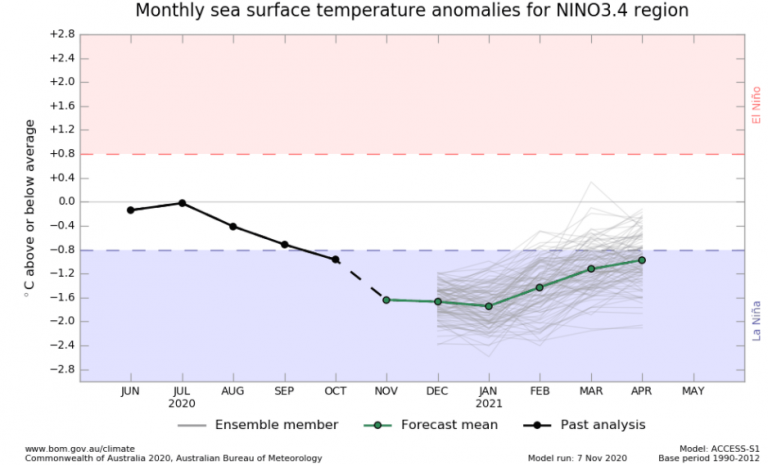
According to the latest report issued by the Australian Bureau of Meteorology (BOM), the La Niña conditions continue in the tropical Pacific: “International climate models suggest it is likely to continue at least through February 2021.”

Peak La Niña conditions expected in January, 2021. Chart source: BOM.
Central and eastern tropical Pacific Ocean sea surface temperatures (SSTs) are at La Niña levels, and remain similar compared to two weeks ago, reports the BOM. “Models continue to suggest some possibility that central and eastern tropical Pacific SSTs could briefly reach levels similar to 2010–12, with the peak most likely in December 2020 or January 2021.”
The BOM uses the ACCESS–S model for generating its forecasts.
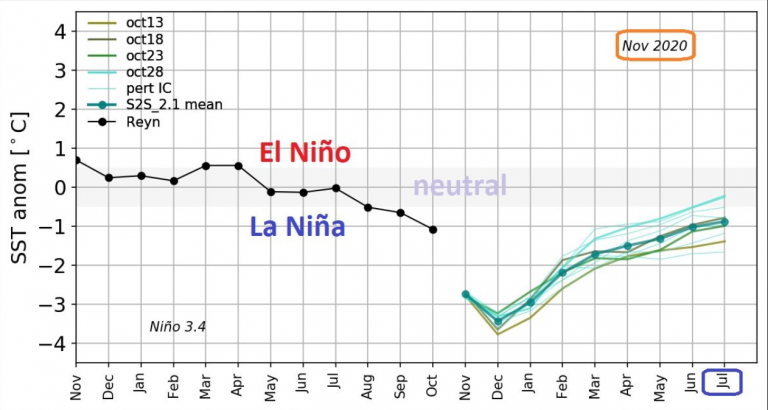
NASA: temperature deviation to -3°C

Mean while Snowfan here reports that NASA prognoses are in fact expecting an “unusually powerful La Niña development, with cooler than normal surface anomalies extending into the summer of 2021 and which could become an extended year-long event, which also occurred in 2010 – 2012. . . .
So... what, exactly, is NASA saying is going to cool by 3C?
 
The drop will be steep.

Cooling Planet: NASA Projects Deep La Niña Event, Peak Temperature Deviation Up To -3°C!
By P Gosselin on 14. November 2020

Share this...
Share on FacebookTweet about this on Twitter
Data from NASA point to a powerful Pacific La Nina event in the works, and so with it could bring a considerable drop in the mean global surface temperature in 2021.
According to the latest report issued by the Australian Bureau of Meteorology (BOM), the La Niña conditions continue in the tropical Pacific: “International climate models suggest it is likely to continue at least through February 2021.”

Peak La Niña conditions expected in January, 2021. Chart source: BOM.
Central and eastern tropical Pacific Ocean sea surface temperatures (SSTs) are at La Niña levels, and remain similar compared to two weeks ago, reports the BOM. “Models continue to suggest some possibility that central and eastern tropical Pacific SSTs could briefly reach levels similar to 2010–12, with the peak most likely in December 2020 or January 2021.”
The BOM uses the ACCESS–S model for generating its forecasts.
NASA: temperature deviation to -3°C

Mean while Snowfan here reports that NASA prognoses are in fact expecting an “unusually powerful La Niña development, with cooler than normal surface anomalies extending into the summer of 2021 and which could become an extended year-long event, which also occurred in 2010 – 2012. . . .
You love models....until you hate them
Lol
 
So... what, exactly, is NASA saying is going to cool by 3C?

SST anomaly.


Source: BOM NASA/GMAO-ENSO-Prognosen

“November 2020 sees an unusually strong La Niña in the equatorial Pacific with temperature deviations down to below -3°C and with unusually long duration until NH summer 2021,” Snowfan writes. “If the current NASA forecast is correct, a multi-year La Niña could develop into 2022, just like in 2010-2012.”

Strong and long La Niña events cool the Earth by several tenths of a degree Celsius with a time lag. The overall global cooling occurring since 2016 will therefore continue at least until 2021 and could even last until 2022. . . .
 
Back
Top Bottom