• This is a political forum that is non-biased/non-partisan and treats every person's position on topics equally. This debate forum is not aligned to any political party. In today's politics, many ideas are split between and even within all the political parties. Often we find ourselves agreeing on one platform but some topics break our mold. We are here to discuss them in a civil political debate. If this is your first visit to our political forums, be sure to check out the RULES. Registering for debate politics is necessary before posting. Register today to participate - it's free!

OMG "All the scientist" were WRONG.

Then you do understand that, when the facts point to a defunct transmission, the customer saying, "But I can't afford that. Can't you make it a clogged filter instead?" doesn't change those facts one whit.

Yup, and I know there is a guy down the road who will change the filter and add some magical cure all fluid to it and "hope" that will do it, knowing full well it won't but is willing to do it anyway to charge a couple of bucks for trying.
 
Yup, and I know there is a guy down the road who will change the filter and add some magical cure all fluid to it and "hope" that will do it, knowing full well it won't but is willing to do it anyway to charge a couple of bucks for trying.

Much the same as there are individual scientists who will tell people what they want to hear and avoid the hard realities. We should learn to avoid such people.
 
Much the same as there are individual scientists who will tell people what they want to hear and avoid the hard realities. We should learn to avoid such people.

Likewise for politicians.
 
After Mt St Helens erupted all the scientist said it would take 100s of years to recover, they were wrong. Imagine THAT! :lol:

"When Mount St. Helens erupted in 1980, scientists tried to apply longstanding theories to predict the recovery of plants and animals. It turned out that nature was a difficult teacher.
``We were wrong at least 50 percent of the time.'' - Larry Bliss, professor of botany, University of Washington.
``Biologists were totally blind-sided by the eruption on May 18, 1980.'' - Jerry Franklin, professor of forest resources, University of Washington.
``Conventional wisdom said that fish shouldn't have survived (in streams choked with silt and heated by the volcano). But they did.'' - Jim Sedell, Forest Service researcher, Corvallis, Ore.
``To our amazement (two contradictory theorized processes of how recovery should take place) occurred within a meter of each other.'' - Jim McMahon, Utah State University biologist.
The comments came during a recent visit to the devastated area arranged by Reps. Jolene Unsoeld and Sid Morrison, whose congressional districts share the volcano. The tour was designed to draw attention to the need for continued study of the recovery, which, in many ways, has astounded scientists."

Living | Mount St. Helens Aftermath: Mother Nature Has Fooled US | Seattle Times Newspaper
When it doesn't fit their dumb theory of reducing CO2 levels to pristine levels, climate scientists really don't know much. I don't know if any climate scientists pointed this out, but the average temperature of the region around Mount St. Helens dropped after the eruptions..... after 'stuff' was shot high up into the 'sphere.
 
View attachment 67152314
That is when the study was done and published.
Do you have newer data that contradicts the hundred year correlation trend ?
Note that there was a downward occurrence around 1940 that lasted for almost ten years but the larger trend continued to rise establishing the relatively linear correlation between CO2 emissions and average global temperature over the larger sample.
Even if there were another eight year aberration in the linear nature of the relationship the larger curves correlation has been well established at over ten times that aberration, and so, demonstrates the likely relationship of causation between the rise of CO2 and average global temperature.
What do you have?.
The link you posted was updated in 2011, so their graph was already 6 years old,
and had already started to show a leveling out.
When compared to current data,
climate4you GreenhouseGasses (You have to go down about 10 pages)
The timing of the graph becomes suspect, because they had more recent data, but choose
not to display it.
 
Here are some more recent graphs. The first being the Keeling curve that demonstrates the continued rise in measurable CO2 levels in the atmosphere as sampled in three global locations and averaged together. This data has been widely accepted as irrefutable.
Mauna_Loa_Carbon_Dioxide_Apr2013.svg.jpg
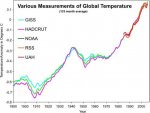
Here is a composite global temperature graph that takes the independent findings of five different studies and overlays them to demonstrate agreement in the data.
Temperature_Composite_500.jpg
Note that the data is more recent than the composite graph I previously posted.
Minor aberrations in linear relationship occur over the sample but in the long-view the correlation and highly likely causal relationship is demonstrably well established.
A similar " leveling out" occurred in 1985 and as in the 1940" leveling out" the trend in rising temperatures continued. If historical trends can demonstrate anything it is that the rise in temperature is consistent if not always contiguous.
 
Last edited:
I don't know him.

He must be a rare one.

He is. A very honorable man who came from humble beginnings and has done some wonderful things including creating the Hope Scholarship (for technical colleges) and the Hope Grant for state colleges.
 
Here are some more recent graphs. The first being the Keeling curve that demonstrates the continued rise in measurable CO2 levels in the atmosphere as sampled in three global locations and averaged together. This data has been widely accepted as irrefutable.
View attachment 67152317
Here is a composite global temperature graph that takes the independent findings of five different studies and overlays them to demonstrate agreement in the data.
View attachment 67152318
Note that the data is more recent than the composite graph I previously posted.
Minor aberrations in linear relationship occur over the sample but in the long-view the correlation and highly likely causal relationship is demonstrably well established.

Just curious, why are their discrepancies in the early data? I'm looking at about 1910. Shouldn't they all be exactly the same given they all had the same evidence to look at?
 
Just curious, why are their discrepancies in the early data? I'm looking at about 1910. Shouldn't they all be exactly the same given they all had the same evidence to look at?
A good question and I do not have a good answer for their spread at that point. However the important observation to make is that the data trends agreed, forming paralleled graphs that back up the contention of overall rising temperatures beginning at or around the start of the industrial revolution. The GISS data points are generated by NASA... maybe they have some insight into the accuracy of historical record-keeping that the others did not take into account.
 
Last edited:
Then you do understand that, when the facts point to a defunct transmission, the customer saying, "But I can't afford that. Can't you make it a clogged filter instead?" doesn't change those facts one whit.

I wish Obama and his advisors had your insight.
 
If anybody here done come from a monkey, it's you. Billy Jo, go fetch me a science feller. We got us a live one what's done gonna prove it once and for all. We got us a livin whatjacallit.


Don't u take dat tone wif me, college boy. I say it one mo' time. I. Hain't. No. Munkee!
 
The scientific consensus NEVER WAS SETTLED. From the article:

Not sure if you are capable of doing simple arithmetic but that means that in his opinion they were correct 50% of the time as well.
There were in fact some scientists 30 years ago that said that the area could and would recover by now. No scientific consensus for a predicted timeline for recovery of the area was ever established.
The sum total of your knowledge on the subject comes from one article in the Seattle Times that you no doubt were steered to from some right wing blog... and you didn't even read it beyond to headline ...
Ha ha ha ha ha ha ha:lamo
Your ignorant indictment of all science based on a newspaper reporter's misinterpretation of what the science consensus was 30 years ago is hilariously misinformed and sophomoric.:lamo

So you are OK with AGW being wrong 50% of the time?
 
I know y'all love to bust Sawyer's balls but it isn't exactly unheard of for practitioners in the sciences to come up with a theory and then seek first to prove it rather than to explore it and find out whether it actually holds water. It also isn't all that unusual for academic studies to explore stuff that politicians like because that keeps the funding coming in.

My balls are just fine, in fact when these warmers choose to attack me because they can't deal with the facts I bring up the boys swell with pride.:)
 
So you are OK with AGW being wrong 50% of the time?
No. You are the one who has drawn the conclusion that scientists projecting the ecological recovery timeline of the Mt St Helens forest are the same people who are studying the causal relationship between the indisputable rise in CO2 levels and the well documented rise in average global temperature. They are not. There never was a consensus among the group studying that ecosystem as I pointed out within the article you sited. The quantum leap in logic you insist on taking, that if some scientists in an unrelated field of study could be wrong that all scientists studying all earth sciences are equally wrong, is stunningly ignorant and simple minded.

The scientists studying and supporting the conclusion of Anthropogenic Global Warming are not wrong and in that case there is a consensus.
One does not even need to be a scientist to see the causal relationship between CO2 levels in the atmosphere and average global temperatures.
In fact one does not even need to be very smart to see and understand the relationship.
Yes even you sawyer could understand the relationship .
Look at the graphs.
 
Why does one scientific outcome effect another? Why do the scientists that were wrong about Mt. St. Helens discredit AGW? What do the scientists that were right about Mt. St. Helens support the notion of AGW? Why does a subject with comparatively minimal scientific research take validity away from a subject with intense scientific research?

This adds nothing to the conversation. If this was a rebuttal to somebody that said "scientists are always right about everything 100%" I guess it would be a decent retort but...?

This goes to show the level AGW deniers are on, you're scraping the very bottom of the intellectual trough.
 
In college one of my research papers I did was on the Mt. St. Helens eruption. The focus was largely on how it changed our way of thinking about volcanic eruptions, what we didn't know at the time, what we know now, etc. I read the newspaper link and its somewhat off from what my understanding was.

They didn't even know about the impact blast which killed some scientists who were directly in its path. Later they would realize this was likely what caused the Kamchatka disaster in Russia, not aliens or an atomic bomb test. Whether a species survived or died was mostly based on luck. Most species directly hit by the blast were wiped out. Animals that were away by accident survived, those that were underground or underwater often survived.

The recovery is highly varied across the region. In some areas the recovery was incredible, the ecological output is better than it previously was. Others did not fare so well and have been stubbornly stagnant. Many species that were held back by natural order pre-blast flourished and quickly dominated as this created a new opportunity to compete and thrive. The old-growth forest of course is no longer in part of that area. The flows of debris running down the rivers caused all kinds of problems. They found that leaving some timber had a positive outcome, though most of it was salvaged for use.

Kind of sad all this interesting science is being pooped on.
 
My balls are just fine, in fact when these warmers choose to attack me because they can't deal with the facts I bring up the boys swell with pride.:)

Wut, like a .... MUNKEE???!!!

big-balls-chimp.jpg
 
Back
Top Bottom