• This is a political forum that is non-biased/non-partisan and treats every person's position on topics equally. This debate forum is not aligned to any political party. In today's politics, many ideas are split between and even within all the political parties. Often we find ourselves agreeing on one platform but some topics break our mold. We are here to discuss them in a civil political debate. If this is your first visit to our political forums, be sure to check out the RULES. Registering for debate politics is necessary before posting. Register today to participate - it's free!

NASA Study confirms that there was no "pause" in the warming

I only have one question... how long have we been measuring the temperatures of the vast depths of the equatorial Pacific and Indian Oceans?

This study noted observational data over the last 20 years. But I am fairly certain that temperature measurements from this depth and region go back further.
 
Utterly and completely false. Sensitivity is not, and never has been, an input to emissions scenarios. Emissions scenarios are just that: emissions. Period.

Oh-for-one.


And way back in post #124, I pointed out that the difference in emissions scenarios in 2015 is utterly trivial. So your statement that the emissions of "RCP 4.5 is quite a bit lower than expected or observed" is, once again, completely false.

Oh-for-two.


That's when the runs were released, but that's not when they were executed. All emissions scenarios use historical emissions through 2005, while post-2005 emissions are forecast, not hindcast. Thus in 2015 we've got 10 years of forecast, not four.

Oh-for-three.
All of your points seem weak when compared to how a paper in Nature describes the pause.
http://www.nature.com/news/climate-change-the-case-of-the-missing-heat-1.14525
Stark contrast

On a chart of global atmospheric temperatures, the hiatus stands in stark contrast to the rapid warming of the two decades that preceded it. Simulations conducted in advance of the 2013–14 assessment from the Intergovernmental Panel on Climate Change (IPCC) suggest that the warming should have continued at an average rate of 0.21 °C per decade from 1998 to 2012. Instead, the observed warming during that period was just 0.04 °C per decade, as measured by the UK Met Office in Exeter and the Climatic Research Unit at the University of East Anglia in Norwich, UK.
They were expecting the trend from 1978 to 1998 to continue, it did not!
 
This study noted observational data over the last 20 years. But I am fairly certain that temperature measurements from this depth and region go back further.

So observational data over the last 20 or so years was used to "confirm" the last 15 or so years of what we thought were modeling errors? Did we really discover a sudden change in the ocean's cycles as this article purports?

Clearly, the pathways by which Earth’s oceans process heat seem to be changing.

The new study, however, is the first to include a comprehensive analysis of real-world data from the past two decades.

Oh, this study was the "first to include a comprehensive analysis of real-world data". My bad. I'm not sure what it means but it sure sounds like this study is rock solid.
 
So observational data over the last 20 or so years was used to "confirm" the last 15 or so years of what we thought were modeling errors? Did we really discover a sudden change in the ocean's cycles as this article purports?

Oh, this study was the "first to include a comprehensive analysis of real-world data". My bad. I'm not sure what it means but it sure sounds like this study is rock solid.

To be fair, we are using the abstract and with very little understanding of the underlying subject matter to criticize a study published by scientists from the NASA Jet Propulsion Lab. There will likely be points where it is easy to misinterpret or marginalize the results of the study.
 
To be fair, we are using the abstract and with very little understanding of the underlying subject matter to criticize a study published by scientists from the NASA Jet Propulsion Lab. There will likely be points where it is easy to misinterpret or marginalize the results of the study.
I have one issue with the concept that the extra heat since 2000 is hiding in the deep ocean.
The earlier AGW concept was extra CO2 caused higher retained solar energy,
this atmospheric warming would then be amplified into additional atmospheric warming.
The long term equilibrium climate sensitivity (ECS) would take decades or longer,
because of the long time frame it took the oceans to catch up with the atmosphere.
https://en.wikipedia.org/wiki/Climate_sensitivity
A model estimate of equilibrium sensitivity thus requires a very long model integration;
fully equilibrating ocean temperatures requires integrations of thousands of model years.
Now we are told the energy skipped the middle step, and the deep ocean (since 2000) has warmed
without the atmosphere being warmer.
 
You wouldn't be implying that they came to the conclusion FIRST and then backfilled around that with cherry picked facts, would you?
 
You wouldn't be implying that they came to the conclusion FIRST and then backfilled around that with cherry picked facts, would you?
Not me!
I am implying that they are implying that the physics of energy transfer have
mysteriously changed since 2000.
Actually the Pause or hiatus is very inconvenient to the concept of AGW, and must be
explained if they are to stay relevant.
Here is another attempt.
Climate change: The case of the missing heat : Nature News & Comment
They do a good job of saying the pause is important.
Stark contrast
On a chart of global atmospheric temperatures, the hiatus stands in stark contrast to the rapid warming of the two decades that preceded it. Simulations conducted in advance of the 2013–14 assessment from the Intergovernmental Panel on Climate Change (IPCC) suggest that the warming should have continued at an average rate of 0.21 °C per decade from 1998 to 2012. Instead, the observed warming during that period was just 0.04 °C per decade, as measured by the UK Met Office in Exeter and the Climatic Research Unit at the University of East Anglia in Norwich, UK.
 
I have one issue with the concept that the extra heat since 2000 is hiding in the deep ocean.
The earlier AGW concept was extra CO2 caused higher retained solar energy,
this atmospheric warming would then be amplified into additional atmospheric warming.
The long term equilibrium climate sensitivity (ECS) would take decades or longer,
because of the long time frame it took the oceans to catch up with the atmosphere.
https://en.wikipedia.org/wiki/Climate_sensitivity

Now we are told the energy skipped the middle step, and the deep ocean (since 2000) has warmed
without the atmosphere being warmer.

No, my understanding is that we are being told the atmosphere has warmed, but that the ocean (which absorbs roughly 90% of the extra heat) has warmed more. There was no pause to the warming.
 
No, my understanding is that we are being told the atmosphere has warmed, but that the ocean (which absorbs roughly 90% of the extra heat) has warmed more. There was no pause to the warming.
They missed the middle step, the oceans were the long latency factor because it took so long for the
warmer atmosphere to warm the oceans.
The new concept says the oceans are warmed by some other mechanism,
that is somehow different than the mechanism that existed before 2000.
 
You claim that we know with precision what the CO2 signal in the climate is while also claiming that we aren't entirely sure about everything else.
Nope, not what I said at all. But I do have hopes that someday you will learn how to read.

Well, that is what you said. You said that the CO2 warming contribution to the atmosphere was derived through "quantum physics". :roll:

This is how cops know when a perp is lying: he keeps changing his story.

Which averages to....

A different number than the 2-3 C range you incorrectly quoted for the IPCC.

Denier FAIL.

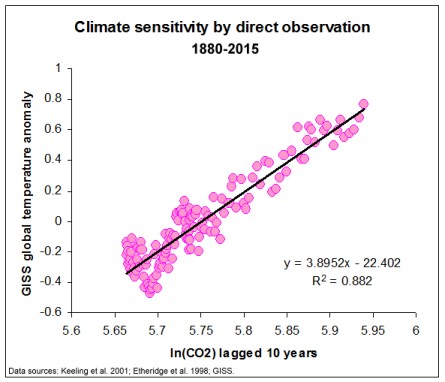
If the warming caused by CO2 doubling is 1.5C then there is no added sensitivity and CO2 would follow the lab logarithmic curve and cease to be a concern.
Wrong on two counts. First, sensitivity to greenhouse gases always follows a logarithmic curve, even with the presence of feedbacks. As this graph shows:
19391738322_6c1f95ebfe_o.jpg


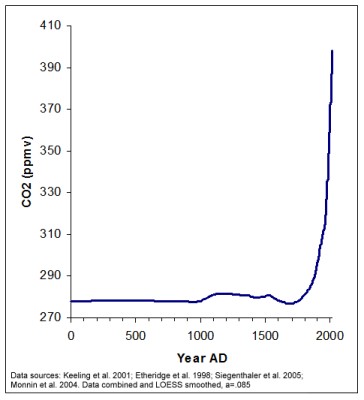
And second, if you think that CO2 isn't a concern, then certainly you will have no trouble answering a simple question:

19391738252_617d72f6d9_o.jpg


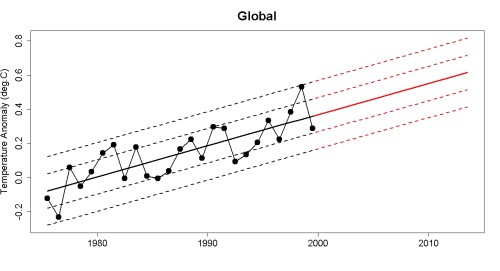
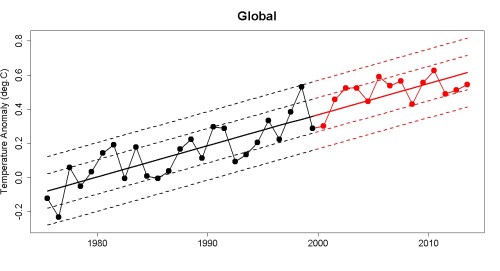
At what point will this trend stop?

You do realize that GISS and HADCRUT make many many "corrections" yearly as well, yes? You do realize that GISS and HADCRUT data points are almost all adjusted from the raw data on a monthly basis, yes?
Sure, but surface corrections are derived from the data itself indicating a break in record continuity, and therefore a need for adjustment. With satellites, everything is far more delicate, and far less straightforward.

So you claim that UAH and RSS make many many corrections to the data, and then settle on GISS that infills missing data with in the global record with artificial data?
It's not artificial at all. The data from a surface station contains more information that the temperature at a single given point, because weather systems are far larger than a single point. So that single point measurement contains information about the entire airmass, which is typically hundreds of km wide.

Your attempt to cover for your cherry picking the warmest climate record is defeated by your own rationale.
Then why don't we agree to use BEST? Even Anthony Watts agreed that their procedure is impeccable. Of course, the BEST trend 1980-2014 is .165°/decade, while GISS is .158°C/decade, so I don't think you've got a leg to stand on. But hey, that's never stopped you before.

Oh, it's absolutely true.
You, sir, are a liar. I await your apology.

Well first I do read climate studies, have read climate studies for two decades, but at this point I have restricted my reading to the studies whose findings amount to more than a cheering section. I have long concluded that the AGW dogma is incapable of describing what the climate data is actually showing. When a study surfaces that claims to have a better model I'll read it.

Same question: how do you know climate studies are inaccurate, if you refuse to read them? Your claim that "we don't know enough" amounts to nothing more than "I haven't yet read enough, and I refuse to read enough."

Denier FAIL.

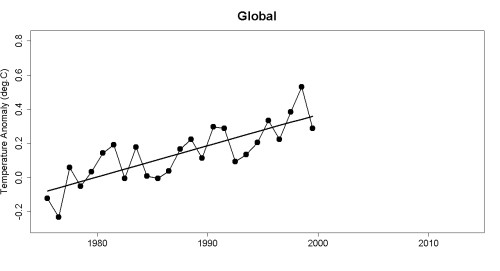
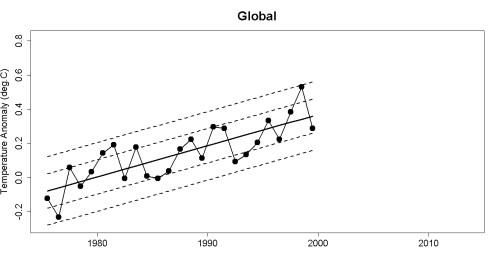
This is an odd claim for you to make, but then you don't really seem to understand statistics. If a flat-line trend fits within the confidence interval of a trend then the trend is statistically insignificant.

No, it's you who don't understand statistics. A flat-line trend is the wrong prior. The correct prior is the existing long-term trend. If you have to shorten your view to the tail end of the dataset to claim statistical insigificance, then you also have to prove that said statistical insignificance is not an artifact of your data selection process. You haven't done that, nor has anyone else.
 
All of your points seem weak when compared to how a paper in Nature describes the pause.
Climate change: The case of the missing heat : Nature News & Comment

They were expecting the trend from 1978 to 1998 to continue, it did not!

That's a news feature, not peer-reviewed science. In fact, the pre-hiatus temperature trend continued as expected:

Pre-hiatus temps:
15635016474_5792e4c9bd_o.jpg


Pre-hiatus temps with regression slope:
16256596862_dec9e8a234_o.jpg


Now draw in 1-sigma and 2-sigma error ranges:
15635016434_df50fc5a0f_o.jpg


Now extend the slope and the error ranges into the 21st century:
16071572237_c65eb645cb_o.jpg


Now plot the actual temperatures through 2013:
16255589271_7c2d0091cd_o.jpg


Even when dropping record year 2014, we still have to ask: Haitus? What haitus?
 
That's a news feature, not peer-reviewed science. In fact, the pre-hiatus temperature trend continued as expected:

Pre-hiatus temps:


Pre-hiatus temps with regression slope:


Now draw in 1-sigma and 2-sigma error ranges:


Now extend the slope and the error ranges into the 21st century:


Now plot the actual temperatures through 2013:


Even when dropping record year 2014, we still have to ask: Haitus? What haitus?
For 1, your plots have no source.
For 2, If you move back the start time far enough you can flatten out the plot.
(Why would you average 25 years with 14 years?, it also reduces you per decade warming.)
 
Statistician Grant Foster, using Cowtan & Way's data.


If you move back the start time far enough, CO2 wasn't driving the climate like it is now. So what?
So Cowtan & Way took one of the primary data sets and tried to remove the cooling bias from around 1998,
by making coverage adjustments.
After the removal of the cooling bias, ...Suddenly the pause does not look as great.
Color me surprised.
No, when we compare apples to apples, the four main data sets show only modest warming
to cooling since 1998.
 
This study noted observational data over the last 20 years. But I am fairly certain that temperature measurements from this depth and region go back further.


The Argo Array of Buoys was fully operational in 2007.

Data from before that date is incomplete and most often, woefully so.
 
So observational data over the last 20 or so years was used to "confirm" the last 15 or so years of what we thought were modeling errors? Did we really discover a sudden change in the ocean's cycles as this article purports?


Oh, this study was the "first to include a comprehensive analysis of real-world data". My bad. I'm not sure what it means but it sure sounds like this study is rock solid.


Only if the data collected and examined was studied in 2027. :)
 
I have one issue with the concept that the extra heat since 2000 is hiding in the deep ocean.
The earlier AGW concept was extra CO2 caused higher retained solar energy,
this atmospheric warming would then be amplified into additional atmospheric warming.
The long term equilibrium climate sensitivity (ECS) would take decades or longer,
because of the long time frame it took the oceans to catch up with the atmosphere.
https://en.wikipedia.org/wiki/Climate_sensitivity

Now we are told the energy skipped the middle step, and the deep ocean (since 2000) has warmed
without the atmosphere being warmer.


I don't think you are allowed to examine the logic and previous statements.

You have been directed to accept and repeat whatever conclusion you are given.

If they want your opinion, you will be provided with one.
 
No, my understanding is that we are being told the atmosphere has warmed, but that the ocean (which absorbs roughly 90% of the extra heat) has warmed more. There was no pause to the warming.

What is the mechanism that caused the warming to be absorbed by the oceans suddenly when the oceans were not doing so previously?

What are the instrument in the Deep Ocean that are collecting this data?
 
Last edited:
That's a news feature, not peer-reviewed science. In fact, the pre-hiatus temperature trend continued as expected:

(edited to get under the allowed picture limit.)

Now plot the actual temperatures through 2013:
16255589271_7c2d0091cd_o.jpg


Even when dropping record year 2014, we still have to ask: Haitus? What haitus?


You are welcome to your own opinions, but the facts must be those that are factual.


AllInOneQC1-2-3GlobalMonthlyTempSince1979.gif

Superimposed plot of Quality Class 1 and Quality Class 2 and Quality Class 3 global monthly temperature estimates. As the base period differs for the different temperature estimates, they have all been normalised by comparing to the average value of 30 years from January 1979 to December 2008. The heavy black line represents the simple running 37 month (c. 3 year) mean of the average of all temperature records. The numbers shown in the lower right corner represent the temperature anomaly relative to the above average. Values are rounded off to the nearest two decimals, even though some of the original data series come with more than two decimals.Last month shown: May 2015. Last diagram update: 7 July 2015.
 
Statistician Grant Foster, using Cowtan & Way's data.


If you move back the start time far enough, CO2 wasn't driving the climate like it is now. So what?


The globe's temperature was rising in about 1600 long before the globe's CO2 was rising. The globes temperature fell pretty dramatically for hundreds of years until 1600 with CO2 showing no drop as reflected in your chart.

The Globe's CO2 has been rising continuously since 2003 and yet the globe's temperature has slowed dramatically.

When the TSI has risen or dropped, the warming has risen or dropped.

Various ither cycles also seem to impact the rise and fall of temperature.

You are tasked to prove the causal link you claim exists by real world observation.

Simply using faith to assert that this a truth absent solid empirical evidence is religion, not science.
 
Last edited:
Back
Top Bottom