• This is a political forum that is non-biased/non-partisan and treats every person's position on topics equally. This debate forum is not aligned to any political party. In today's politics, many ideas are split between and even within all the political parties. Often we find ourselves agreeing on one platform but some topics break our mold. We are here to discuss them in a civil political debate. If this is your first visit to our political forums, be sure to check out the RULES. Registering for debate politics is necessary before posting. Register today to participate - it's free!

My Own Silly Thought

Non random errors are called bias or systematic errors,
Wow! That's soooo good to know. But how do non-random errors accumulate?


And you can google "error" too! But how do non-random errors accumulate?

Years ago a coworker told me a story about counting paper money by weight.
It seemed that the treasury could count circulated paper money by weight, with some accuracy,
but not new money. His job was to find out why.
It turns out that with a stack of 50 bills, the error of too much or too little paper on the edge,
accumulates, and causes the error in the weight of a stack to be too large a range to count.
With circulated money, the edge widths are randomized.
I recall he said they decided not to use weight as a counting method for paper money.

Still doesn't answer the question, because the errors in money weight should random errors, not non-random errors.

So how do non-random errors accumulate?
 
Wow! That's soooo good to know. But how do non-random errors accumulate?


And you can google "error" too! But how do non-random errors accumulate?


Still doesn't answer the question, because the errors in money weight should random errors, not non-random errors.

So how do non-random errors accumulate?
In the paper money story, each stack has an accumulated error within the stack,
all the errors are biased one way within the stack.
For temperature, published papers show a positive bias in the (Tmax and Tmin) method.
Sampling Biases in Datasets of Historical Mean Air Temperature over Land
The estimation of mean Ta by Td1 has two primary sources of bias: (1) Ta has an asymmetric diurnal curve, and (2) Td1 collects only two samples of Ta from the early morning to the early afternoon and leaves roughly two thirds of a day without monitoring. The former introduces systematic bias to Td1, and the later primarily introduces random bias.
Perhaps accumulation, would be unlikely, but an offset would be present.
Something else that that is a concern was the statement,
However, the trend of Td1 has a substantial bias at regional and local scales, with a root mean square error of over 25% at 5° × 5° grids. Therefore, caution should be taken when using mean Ta datasets based on Td1 to examine high resolution details of warming trends.
I am not sure how a local/regional RMS error over 25%does not carry into the broader averages.
 
In the paper money story, each stack has an accumulated error within the stack,
all the errors are biased one way within the stack.

Total crapola, and you know it. Errors in weights of bills are random. Were it not so, you could count bills by their weight.
How do non-random errors accumulate?

For temperature, published papers show a positive bias in the (Tmax and Tmin) method.
Sampling Biases in Datasets of Historical Mean Air Temperature over Land

Which, as a bias, is a non-random error, hence can be corrected out.
How do non-random errors accumulate?

Perhaps accumulation, would be unlikely, but an offset would be present.

Precisely the point. It can be corrected.
How do non-random errors accumulate?

Something else that that is a concern was the statement,
...
I am not sure how a local/regional RMS error over 25%does not carry into the broader averages.

Perhaps the reason you don't know that is because you know nothing about statistics. Or maybe you just failed to read your own cited reference, which also states:
"the use of T[sub]d1[/sub] has a negligible impact on the global mean warming rate." Emphasis added. Just in case you didn't get it.

So I guess those non-random errors in T[sub]d1[/sub] didn't accumulate then. Did they?
 
Last edited:
Total crapola, and you know it. Errors in weights of bills are random. Were it not so, you could count bills by their weight.
How do non-random errors accumulate?
The way I understand the story on the money, was in a stack of 50, the cutters are off a bit,
so that the physical area of an single bill could be larger or smaller that a single bill from some other stack.
That error, however slight is multiplied by the number of bills in that stack,
the error accumulates.


Which, as a bias, is a non-random error, hence can be corrected out.
How do non-random errors accumulate?


Precisely the point. It can be corrected.
?
It can be corrected, if it is consistent and known, and since the error is a positive bias, the correction would be to
lower the average temperature.
Since the paper identifying this bias is only 2 years old, I wounder how many corrections they have made
that lowered the temperature in the last 2 years.


Perhaps the reason you don't know that is because you know nothing about statistics. Or maybe you just failed to read your own cited reference, which also states:
"the use of T[sub]d1[/sub] has a negligible impact on the global mean warming rate." Emphasis added. Just in case you didn't get it.[/QUOTE]
I will readily admit, I am not the statistics expert, but understand how summing signals work
for noise cancellation. A non random error could be amplified, just like the signal with repeated samples.
Is that happening, unlikely, more likely the artifact would just be an offset.
When the author says the error will have negligible impact on the global mean warming rate,
he is qualifying his words a bit, the rate is a change per period, which might not show a DC offset.
Also this is not some minor error, the cooler season error is .3 C, close to 1/3ed of all of the observed warming.
 
The way I understand the story on the money, was in a stack of 50, the cutters are off a bit,
so that the physical area of an single bill could be larger or smaller that a single bill from some other stack.
That error, however slight is multiplied by the number of bills in that stack,
the error accumulates.


Which, as a bias, is a non-random error, hence can be corrected out.
How do non-random errors accumulate?


It can be corrected, if it is consistent and known, and since the error is a positive bias, the correction would be to
lower the average temperature.
Since the paper identifying this bias is only 2 years old, I wounder how many corrections they have made
that lowered the temperature in the last 2 years.


Perhaps the reason you don't know that is because you know nothing about statistics. Or maybe you just failed to read your own cited reference, which also states:
"the use of T[sub]d1[/sub] has a negligible impact on the global mean warming rate." Emphasis added. Just in case you didn't get it.
.
I will readily admit, I am not the statistics expert, but understand how summing signals work
for noise cancellation. A non random error could be amplified, just like the signal with repeated samples.
Is that happening, unlikely, more likely the artifact would just be an offset.
When the author says the error will have negligible impact on the global mean warming rate,
he is qualifying his words a bit, the rate is a change per period, which might not show a DC offset.
Also this is not some minor error, the cooler season error is .3 C, close to 1/3ed of all of the observed warming.

LOL. So in other words , if you use more stacks, the errors become more random, and the result more reliable.

You didn't describe no random error sampling, you described small sample size.
 
.

LOL. So in other words , if you use more stacks, the errors become more random, and the result more reliable.

You didn't describe no random error sampling, you described small sample size.
It would work that way with stacks of money, but with temperature the bias is all positive.
 
Sure. Because librul conspiracy.

Or wait... Maybe it's because GHG?

Naaah.
Have you not read any of this thread?
There was a positive bias found in the temperature data caused from
the difference between (Tmax and Tmin) methodology and the integral of the
continuous temperature measurements over a day.
The error was more pronounced in the cooler months, but was positive all year long.
PubMed Central, Table 1: Sci Rep. 2014; 4: 4637. Published online 2014 Apr 10. doi:  10.1038/srep04637
It is unclear if this positive bias has been corrected in the data, since the paper identifying
it is from 2014. The correction would be to lower the average temperature,
which does not seem to happen much!
 
I am sorry you do not understand the nature of errors, and how non random errors accumulate.
I will readily admit, I am not the statistics expert

The truth at last. And it only took six posts to get there.


Since the paper identifying this bias is only 2 years old, I wounder how many corrections they have made
that lowered the temperature in the last 2 years.

This particular non-random error has zero effect on temperature anomaly. Zero. And this is exactly why they use anomalies instead of absolute temperatures, to eliminate non-random errors of this kind. So there is no correction to be made, because the anomalies are automatically correct for this.
 
The truth at last. And it only took six posts to get there.


This particular non-random error has zero effect on temperature anomaly. Zero. And this is exactly why they use anomalies instead of absolute temperatures, to eliminate non-random errors of this kind. So there is no correction to be made, because the anomalies are automatically correct for this.
Zero, you say, are you so sure?
Think about it?
What does the GISS say?
Data.GISS: GISTEMP ? The Elusive Absolute Surface Air Temperature
Q. What do we mean by daily mean SAT?
A. Again, there is no universally accepted correct answer. Should we note the temperature every 6 hours and report the mean, should we do it every 2 hours, hourly, have a machine record it every second, or simply take the average of the highest and lowest temperature of the day? On some days the various methods may lead to drastically different results.
We know they use both Max-Min and hourly, and there is a positive bias in the Max-Min.
So the stations which still use Max-Min, have a positive bias, while the hourly stations are closer to the
correct Surface air temperature (SAT).
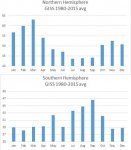
In addition the fact that the offset error varies seasonally, (one must assume the change is analog
and does not adhere to our calendar boundaries) so throughout the year,
the offset varies between .11 C and .30 C.
In the data sets we sure see a seasonal asymmetry, weighted in the cooler months.
seasonal_Asy.jpg
Perhaps CO2 is not seasonally selective on it's warming, but rather we are seeing an artifact
of this offset error.(the roughly .2C delta is about right)
 
So to back up his claim that there has been "no warming", Tim the plumber shows us a graph that proves he's two nipples short of a pipe. Here's the same graph with the linear trend plotted. And guess what? It's warming. Hmmmm.

Wood for Trees: Interactive Graphs

Wow!!!

Just by adding a straight line with a +0.3c growth on it you can get the actual temperature graph to have the same trend line!!!

How biased must your thinking be to not understand that that is a totally dishonest thing to do?
 
Wow! That's soooo good to know. But how do non-random errors accumulate?


And you can google "error" too! But how do non-random errors accumulate?


Still doesn't answer the question, because the errors in money weight should random errors, not non-random errors.

So how do non-random errors accumulate?

It's really easy. Anybody who has done any sort of building or engineering will be able to explain this.

eg;

When you put the lathes on a roof to hold the tiles you put them a certain distance appart. The roof on the house in my picture has a spacing of 11cm for this. When you measure the distance beteen the wooden lathes it is easy to simply measyure an 11cm distance and fix the next piece of wood down.

But this will very quickly lead to a roof where the tiles look like they are waves on a beach. The problem is that when you fix to the joist above your right knee you will miss by +0.5cm (say) and when you fix to the joist to the right of this you can miss by -0.6cm. Whatever it was about that position that made you miss by that amount will be the same on the next row so you will be 1cm and -1.2cm wrong. Although such a miss might be OK for this row the inaccuaracies will add up and by the 10th row you will be so of the roof will look awful. It is necessary to measure from a base line. You will still be 0.5am off but not more than that.

Basic stuff.
 
Wow!!!

Just by adding a straight line with a +0.3c growth on it you can get the actual temperature graph to have the same trend line!!!

How biased must your thinking be to not understand that that is a totally dishonest thing to do?

That was the actual linear regression of the actual data. It's not dishonest, and you're dishonest for suggesting that it was.
 
It's really easy. Anybody who has done any sort of building or engineering will be able to explain this.

eg;

When you put the lathes on a roof to hold the tiles you put them a certain distance appart. The roof on the house in my picture has a spacing of 11cm for this. When you measure the distance beteen the wooden lathes it is easy to simply measyure an 11cm distance and fix the next piece of wood down.

But this will very quickly lead to a roof where the tiles look like they are waves on a beach. The problem is that when you fix to the joist above your right knee you will miss by +0.5cm (say) and when you fix to the joist to the right of this you can miss by -0.6cm. Whatever it was about that position that made you miss by that amount will be the same on the next row so you will be 1cm and -1.2cm wrong. Although such a miss might be OK for this row the inaccuaracies will add up and by the 10th row you will be so of the roof will look awful. It is necessary to measure from a base line. You will still be 0.5am off but not more than that.

Basic stuff.

And those are random errors.

Which doesn't answer the question.
 
Originally Posted by Poor Debater View Post
So to back up his claim that there has been "no warming", Tim the plumber shows us a graph that proves he's two nipples short of a pipe. Here's the same graph with the linear trend plotted. And guess what? It's warming. Hmmmm.
Wood for Trees: Interactive Graphs

That was the actual linear regression of the actual data. It's not dishonest, and you're dishonest for suggesting that it was.

Wood for Trees: Interactive Graphs

Why does your trend line have a upward slope whene there is no data for it to be based on and why does your origonal graph look less of an increase without the additional trend making line?

Also, speaking of utter dishonesty, why do you start the graph 10 years before the time period I was saying had no significant temperature increase? Is that because you know the answer?
 
And those are random errors.

Which doesn't answer the question.

Those errors are happening on the roof due to something which is unkown to the worker. They are however not random. The position you are in when you nail the lathe 1 foot to your left causes you to make an error of +0.5cm. That it is unpredictable makes it seem randon. But it is not it is systematic.

Similarly systematic error causing things can, and do, happen on scientific data collection processes. They are not predictable because if they were predicted they would be eliminated. But they can cause the whole system to be biased and no ammount of maths processing will eliminate them.

I read a while back about the increase in temperature readings caused by changing the paint used on weather stations. From white to a different white. The change was within the error range of the data collecting system so it was not obvious but since the whole AGW argument is based upon the idea that thermometers with an accuracy of +/- 0.5c can give data to an accuracy of thousanths of a degree that sort of thing is highly important.
 
Wood for Trees: Interactive Graphs

Why does your trend line have a upward slope whene there is no data for it to be based on

You're living in dreamland. The line slopes upward because it's a regression line. It slopes upward because the data slopes upward. The line is entirely derived from the data. Do you know what linear regression is?

and why does your origonal graph look less of an increase without the additional trend making line?

Gee, maybe because your eyeballs aren't as accurate as actual math?

Also, speaking of utter dishonesty, why do you start the graph 10 years before the time period I was saying had no significant temperature increase? Is that because you know the answer?

I set it that way because you set it that way when you posted your graph. Do you even remember the graph you posted? No? Well here it is again:

Wood for Trees: Interactive Graphs

And hey, look at that. You're incompetent, and then you accuse me of dishonesty because of that? Shameful. You owe me an apology.
 
You're living in dreamland. The line slopes upward because it's a regression line. It slopes upward because the data slopes upward. The line is entirely derived from the data. Do you know what linear regression is?

Originally Posted by Tim the plumber View Post
Wood for Trees: Interactive Graphs

Why does your trend line have a upward slope whene there is no data for it to be based on
.

Try actually clicking on the link.

There is no data in that graph.

It is the regression line from your origional graph.

It slopes upward.

You use different dates to my origonal statement because you want to change my statement to one you can show to be wrong. That is dishonest. That I used a longer time frame to show some context to the idea is called being honest.
If we ran the same 1998 to 2015 for the RSS data set, it actually has a negative trend.
Wood for Trees: Interactive Graphs
 
Back
Top Bottom